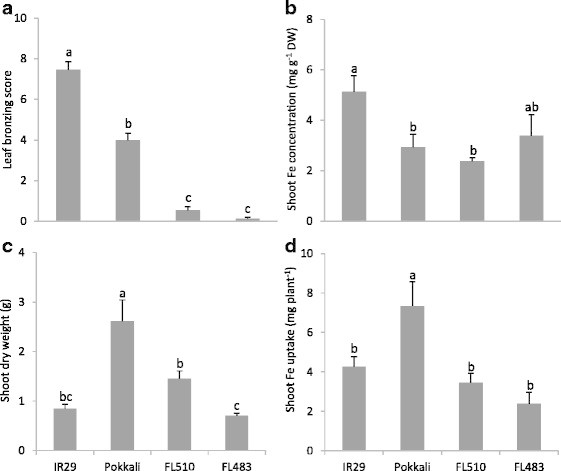
Figure 2.

Phenotypic traits of contrasting lines in IR29/Pokkali population under 1,000 mg L−1Fe2+for 5 days were determined: (a) leaf bronzing score; (b) Fe concentration in shoot; (c) shoot dry weight; (d) total Fe uptake in shoot. Vertical bars represent standard errors of means (n = 4). Different letters above the data points indicate significant differences between genotypes by LSD-test (p < 0.05).
