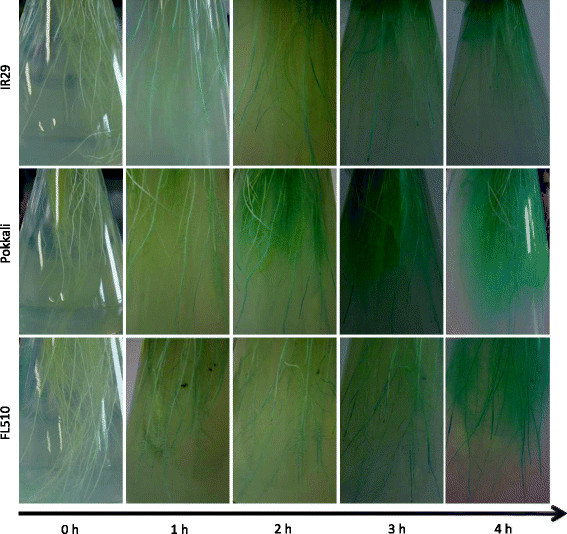
Figure 3.

Time course of root oxidizing power of contrasting lines in IR29/Pokkali population were indicated by color change in Methylene-blue agar solution. Representative photos of 4 replicates per genotype are shown. Horizontal axis represents the time of duration (0–4 hours). Blue color indicates the site of oxygen release from roots.
