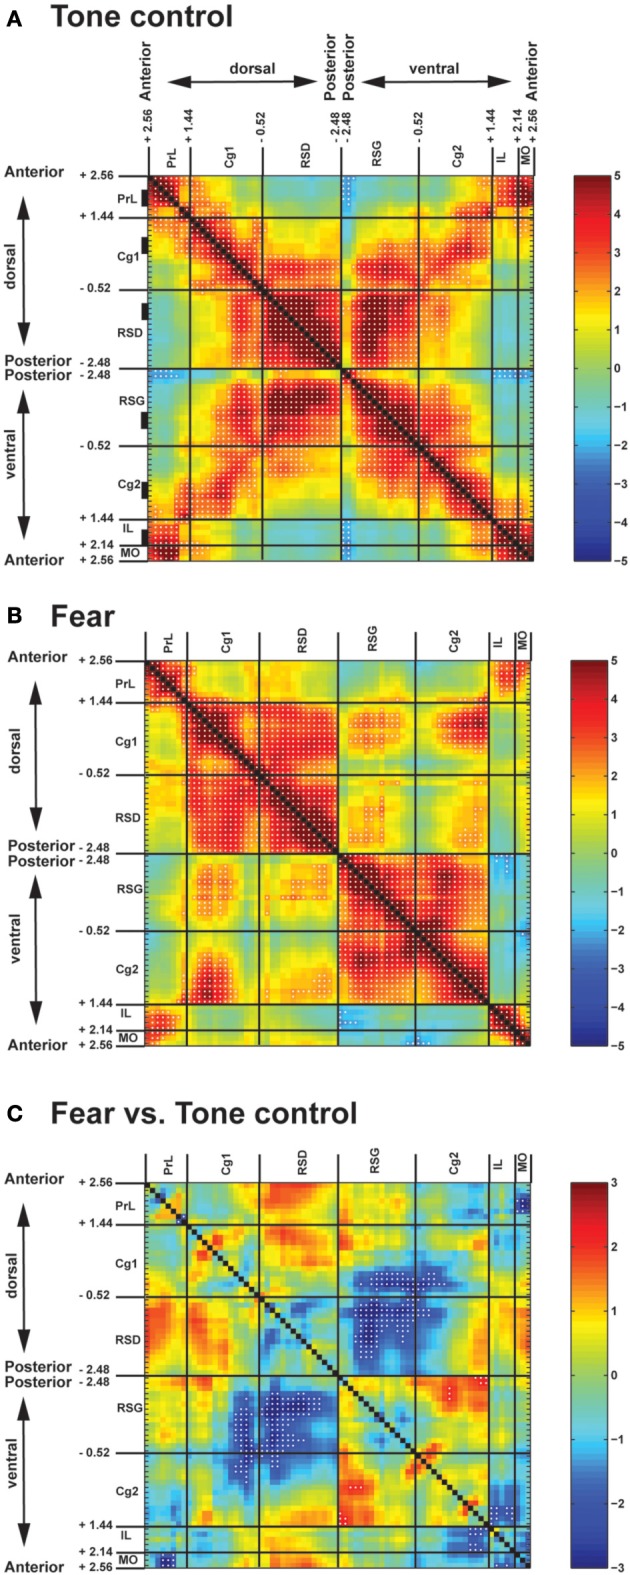
Figure 2.

Pairwise inter-regional correlation matrices showing functional connectivity among cortical midline structures of fear-conditioned and control mice. (A) Control mice exposed to a neutral tone. (B) Fear-conditioned mice during auditory-cued fear recall. Z-scores of Pearson's correlation coefficients are color-coded. Each matrix is symmetric across the black diagonal line from upper-left to lower-right. Significant correlations (P < 0.05) are marked with white dots. (C) Statistical comparison of correlation coefficients between the fear-conditioned and the control group. The matrix of Fisher's Z-statistics represents differences in Pearson's correlation coefficients (r). Positive Z-values indicate greater r in the fear-conditioned group, while negative Z-values indicate smaller r. Significant between-group differences (P < 0.05) are marked with white dots. Numbers along the axes denote the anterior-posterior position in mm relative to the bregma. Black rectangles along the vertical axis in (A) denote anterior-posterior location of region-of-interests used in the seed correlation analysis. Abbreviations: Cg1, cingulate cortex area 1; Cg2, cingulate cortex area 2; IL, infralimbic cortex; MO, medial orbital cortex; PrL, prelimbic cortex; RSD, retrosplenial dystranular cortex; RSG, retrosplenial granular cortex.
