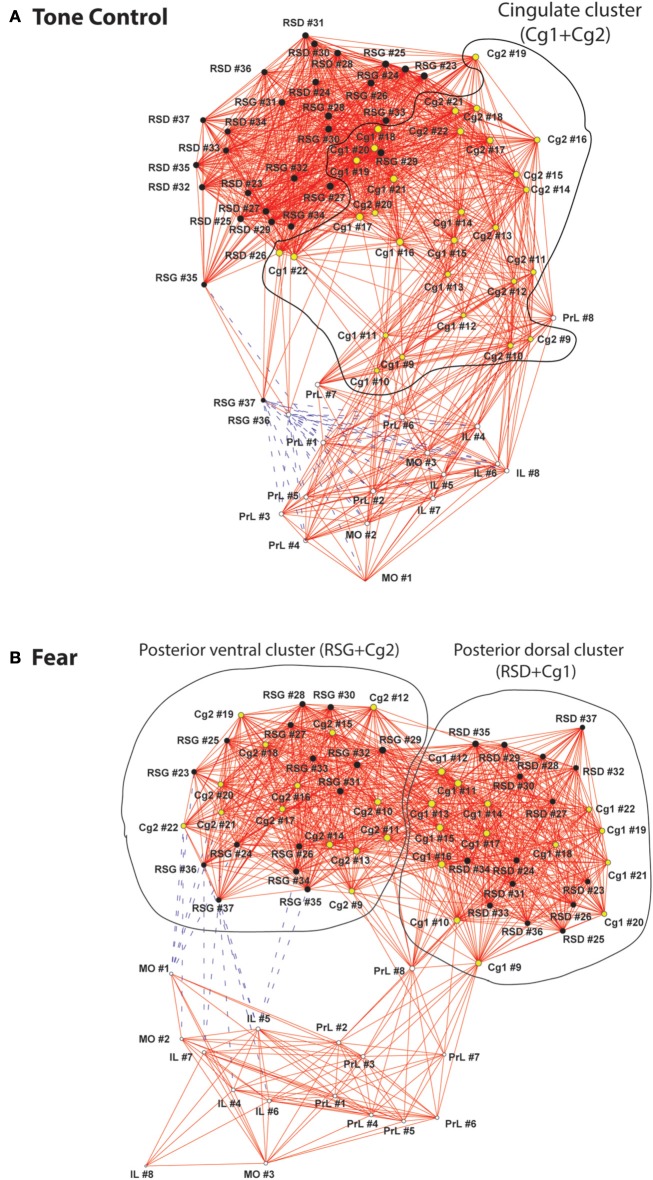
Figure 4.
Graph theoretical analysis of the functional networks of the cortical midline structures. (A) In the control mice, relative location of regions of interest (ROIs) along the anterior-posterior axis was largely preserved topologically in the functional network. The cingulate cluster, which is circled and highlighted in yellow, connected anterior and posterior aspects of the cortical midline structures (CMS). (B) The fear-conditioned mice showed reorganization of the CMS functional network. Two distinct clusters are circled including a posterior dorsal and a posterior ventral cluster. The functional connectivity networks are represented with graphs, in which nodes (vertices) represent region of interests (ROIs) and edges represent significant correlations. Solid red lines denote significant positive correlations, whereas dashed blue lines significant negative correlations. The graphs were energized using the Kamada–Kawai algorithm that placed strongly correlated nodes closer to each other while keeping weakly correlated nodes further apart. The size of each node (in area) is proportional to its degree centrality, a measurement of the number of connections linking the node to other nodes in the network. Abbreviations: Cg1, cingulate cortex area 1; Cg2, cingulate cortex area 2; IL, infralimbic cortex; MO, medial orbital cortex; PrL, prelimbic cortex; RSD, retrosplenial dystranular cortex; RSG, retrosplenial granular cortex. The index numbers denote sequence of ROIs along the anterior-posterior axis, such that #1 denotes the most anterior ROI at 2.56 mm anterior to the bregma, and #37 the most posterior ROI at 2.48 mm posterior to the bregma. The inter-ROI distance along the anterior- posterior axis in the brain is 0.14 mm.

