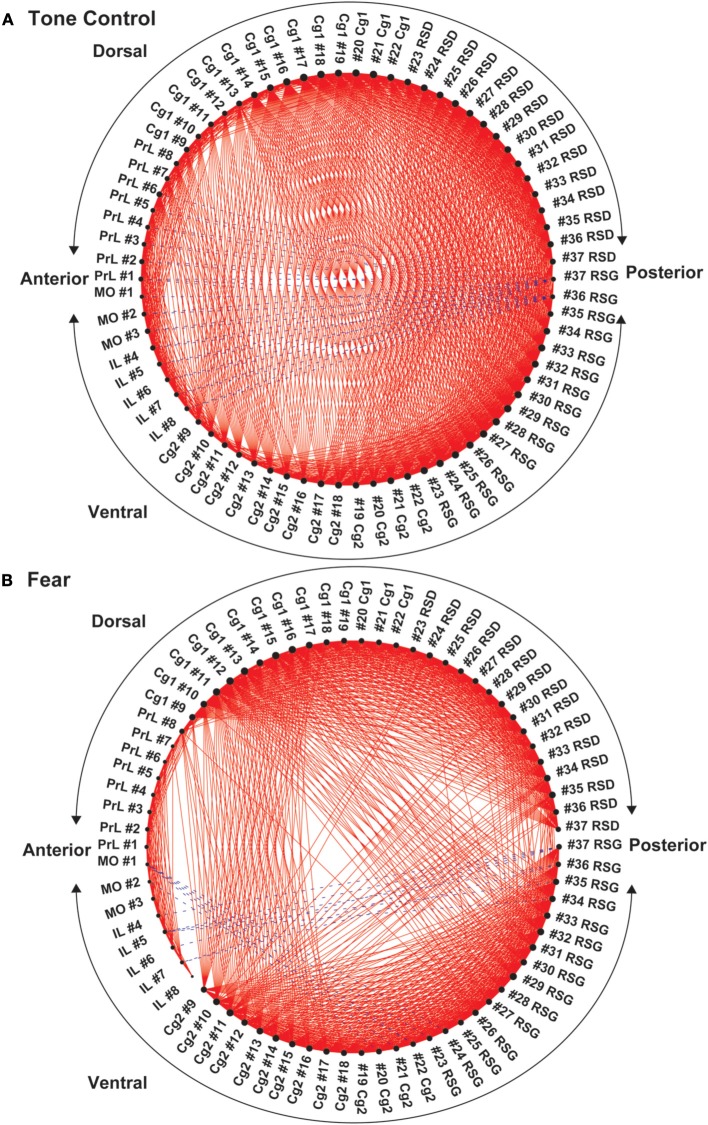
Figure 5.
Circular plot of graphs representing the functional networks of the cortical midline structures (CMS). (A) In control mice, functional segregation was observed along the anterior-posterior axis between the anterior aspect (PrL, MO, IL, anterior Cg1, and Cg 2) and posterior aspect (RSD, RSG, posterior Cg1, and Cg2) of the CMS. (B) In the fear-conditioned mice, functional connectivity between the dorsal and ventral aspect of the CMs was greatly reduced. In each circular plot, regions of interest (ROIs) representing the dorsal CMS are arranged in the upper half of the circle, whereas ROIs representing the ventral CMS are arranged in the lower half. Abbreviations: Cg1, cingulate cortex area 1; Cg2, cingulate cortex area 2; IL, infralimbic cortex; MO, medial orbital cortex; PrL, prelimbic cortex; RSD, retrosplenial dystranular cortex; RSG, retrosplenial granular cortex. The index numbers denote sequence of ROIs along the anterior-posterior axis such that #1 denotes the most anterior ROI at 2.56 mm anterior to the bregma and #37 the most posterior ROI at 2.48 mm posterior to the bregma. The inter-ROI distance is 0.14 mm.

