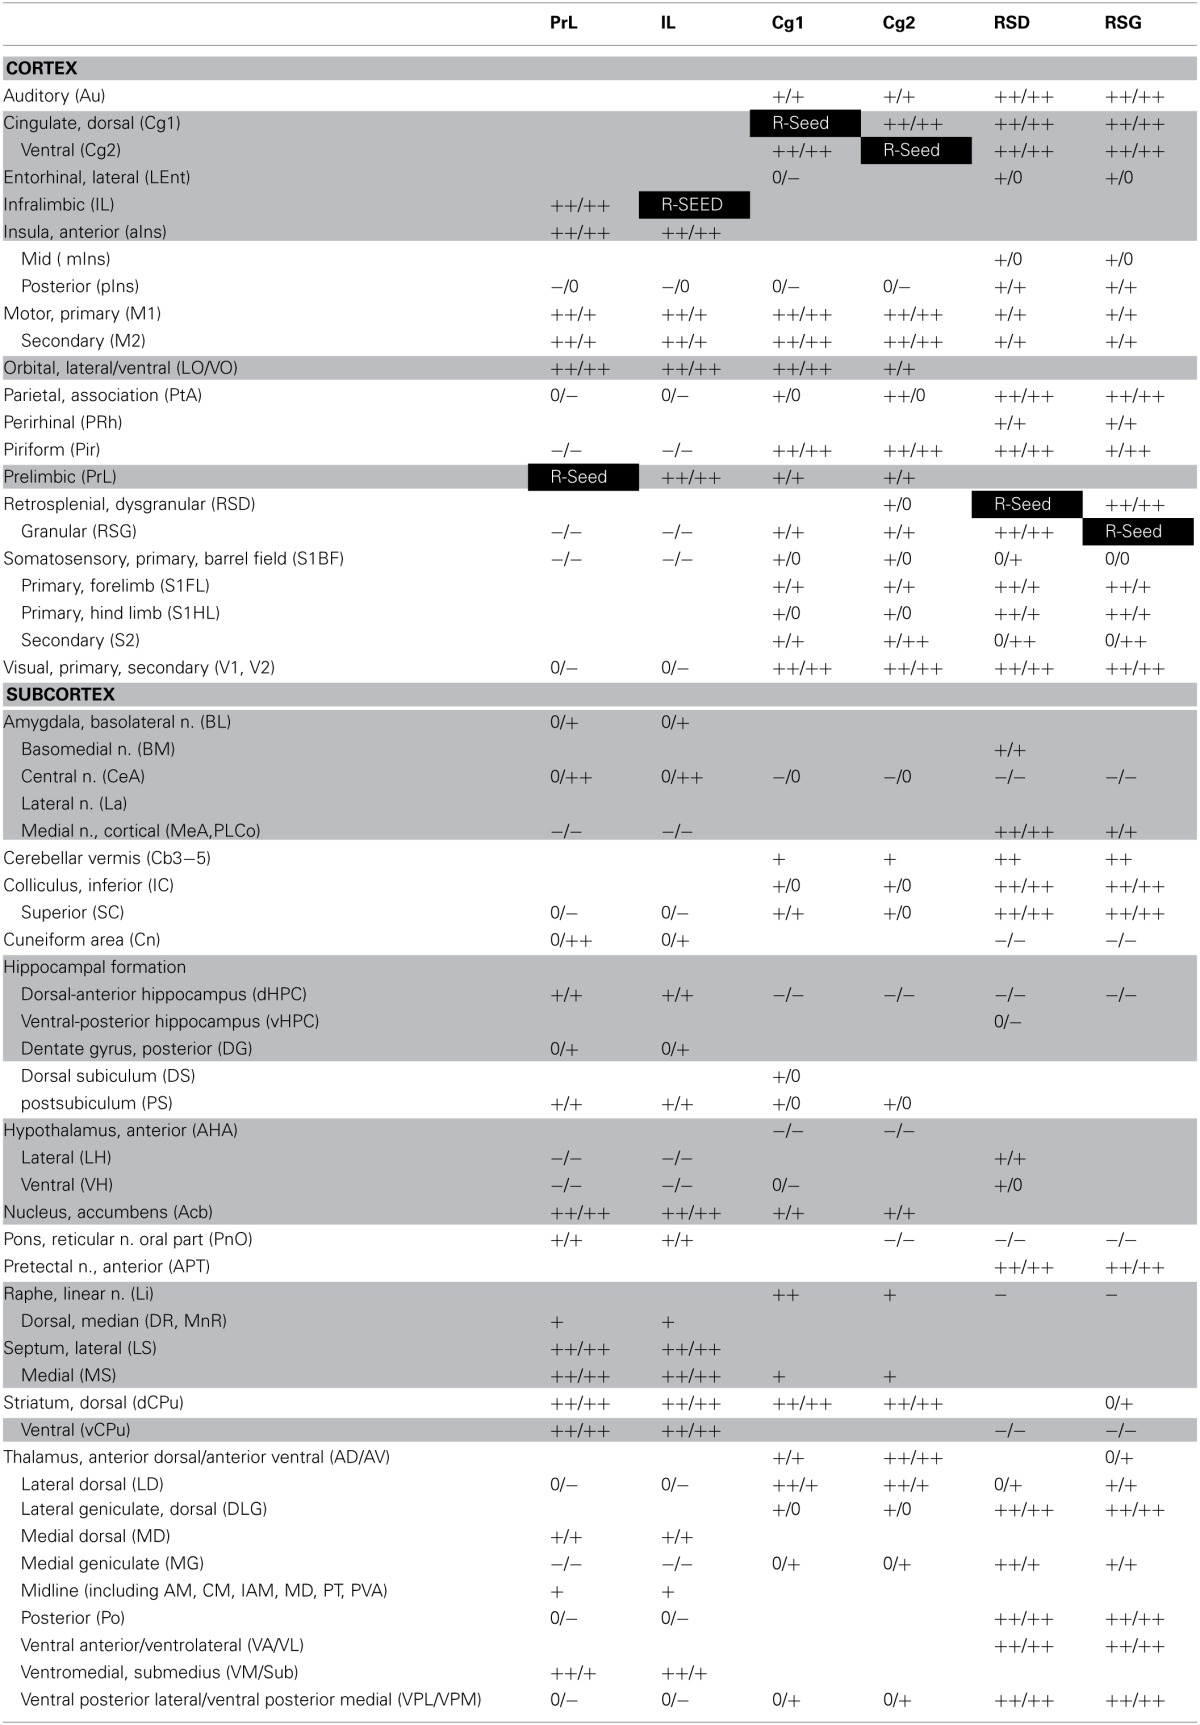
Table 1.
Summary of seed correlation analysis results in the control mice.

Functional connectivity of the cortical midline structures was analyzed using seed correlation for the right prelimbic (PrL), infralimbic (IL), cingulate area 1 (Cg1), cingulate area 2 (Cg2), retrosplenial dysgranular (RSD) and retrosplenial granular (RSG) cortices. Shown are significant left and right (L/R) positive (+) and negative (−) correlations with the seed (P < 0.05, clusters ≥ 100 voxels), with double signs denoting broadly represented correlations. “0” and blank cells denote the absence of significant correlations. Gray shaded cells highlight limbic/paralimbic areas. White text on a black background denotes the seed region.
