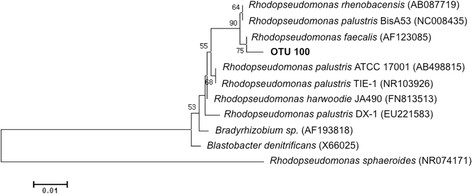
Figure 3.

Phylogenetic tree based on 16S rRNA gene sequences showing the relationships of OUT 100 with members of the genusRhodopseudomonas. Bootstrap values (>50%) are shown on the nodes from 1000 bootstrap replicates. The scale bar represents 5% difference in nucleotide sequences.
