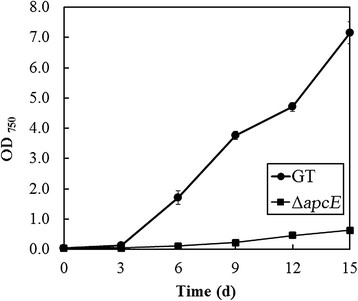
Figure 4.

Growth curves of glucose-tolerantSynechocystissp. PCC 6803 (GT) (closed circles) and the ΔapcEmutant (closed squares) under photoautotrophic and 1% CO2conditions with illumination at 50 μmol photons m−2 s−1. Error bars represent the mean of triplicate experiments.
