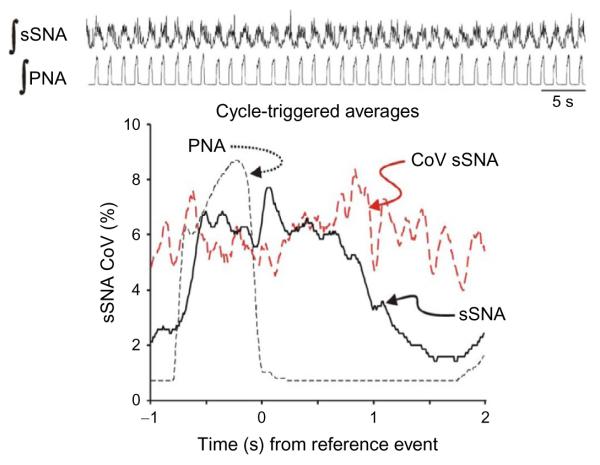
FIGURE 2.
Sympatho-respiratory coupling is high following chronic intermittent hypoxia. The bursts of integrated splanchnic sympathetic nerve activity (∫ sSNA) and integrated phrenic nerve activity (∫ PNA) are highly correlated; this is reflected in the cycle-triggered average of ∫ sSNA in which the nadir is close to 0 and the coefficient of variation (CoV) is low across the respiratory cycle. Traces for this figure and Fig. 3: top, ∫ sSNA and ∫ PNA. Graph: Cycle-triggered averages of ∫ sSNA (black continuous line), ∫ PNA (black dashed line), CoV of ∫ sSNA (red dashed line). Note: The y-axis is scaled for the CoV of ∫ sSNA. Even though the scale of the averages of ∫ sSNA and ∫ PNA is arbitrary because it depends on the amplification of each nerve recording, it does range from zero to a normalized maximum, so the signal-to-ratio is depicted by the averages for that component of the signal that is correlated temporally to the reference event, the offset of inspiration.

