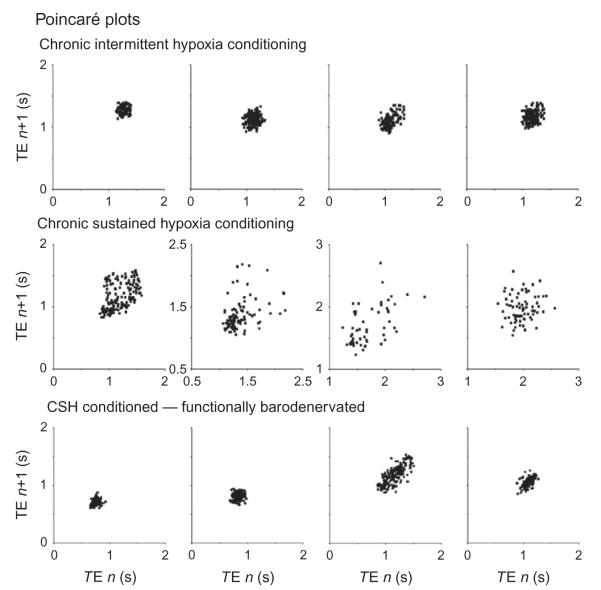
FIGURE 4.
Poincaré plots. The duration of expiration (TE) of the next cycle is plotted against the TE of the current cycle to display cycle-to-cycle variability. In four chronic intermittent hypoxic-conditioned rats, the variability of TE is small and forms a tight cluster points. Compare this to four chronic-sustained hypoxic-conditioned rats in which the points are distributed widely. However, the distribution forms a tight cluster after both the aortic depressor and carotid sinus nerve are transected.

