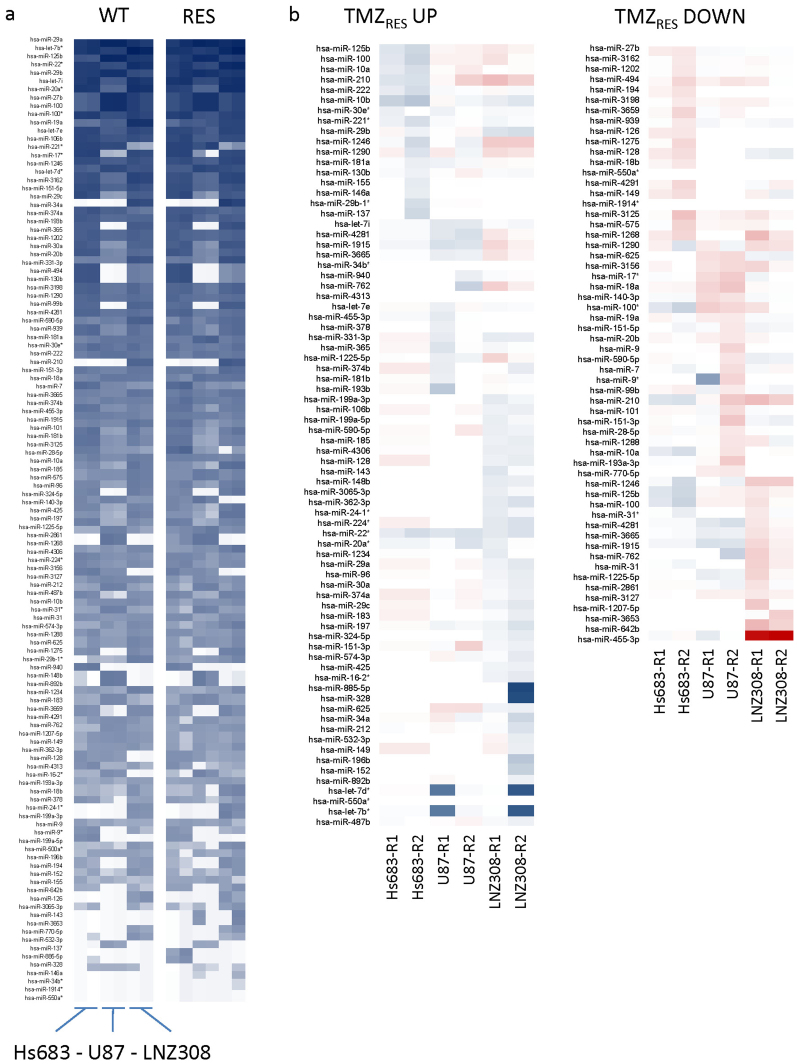
Figure 1. miRNA expression profiles of wild type and TMZ-resistant subclones.
(a), overall miRNA expression profiles of Hs683, U87, and LNZ308 wild type and resistant subclones, sorted based on overall expression levels in all cell lines, both TMZ-sensitive and TMZ-resistant, with highly expressed miRNAs at the top and lowly expressed miRNAs at the bottom. (b), heatmap of upregulated (left) and down regulated (right) miRNAs in resistant subclones. TMZRES UP heatmap: blue = strong upregulation, light blue = upregulation, red = modest upregulation. TMZRES DOWN heatmap: red = strong downregulation, light red = downregulation, blue = modest downregulation.

