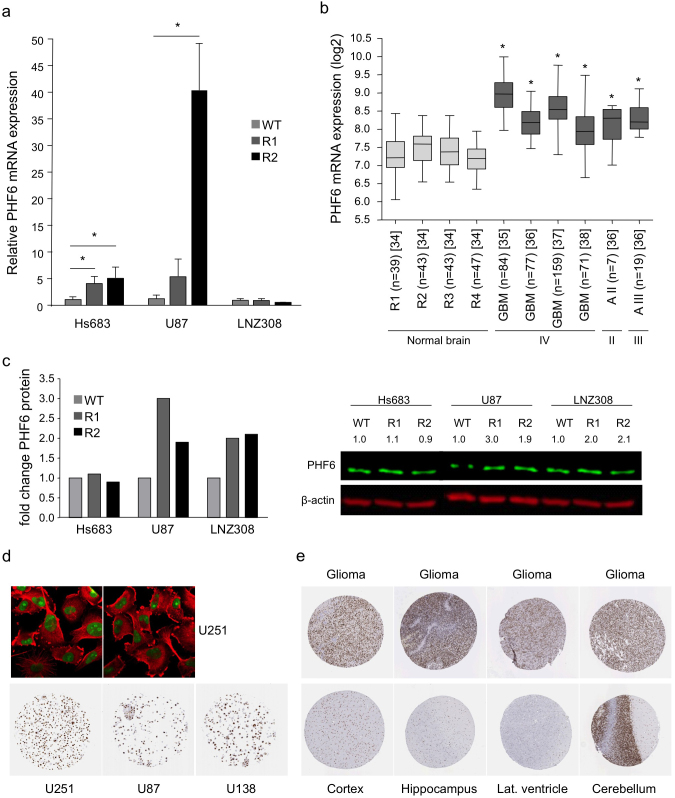
Figure 4. PHF6 mRNA and/or protein expression is increased in TMZ-resistant cells and primary glioblastoma samples.
(a), PHF6 mRNA levels in wild type and TMZ-resistant subclones as determined by qRT-PCR. (b), in silico analysis of PHF6 mRNA expression in normal brain tissue (grey) of different brain regions (R1 = entorhinal cortex, R2 = hippocampus, R3 = post central gyrus, R4 = superior frontal gyrus)34, in glioblastoma (grade IV) tissue, and in grade II (II) and III astrocytoma (III) tissue (dark grey)35,36,37,38 using R2 analysis software. (c), PHF6 protein expression in Hs683, U87, and LNZ308 wild type and TMZ-resistant subclones as determined by Western blotting. (d), immunofluorescent staining of PHF6 (green) in the nucleolus of U251 glioblastoma cells. Microtubules are stained in red. PHF6 is highly expression in U251 and U138 glioblastoma cell lines and moderately expressed in U87 glioblastoma cell line. (e), PHF6 protein expression in normal brain tissue (cortex, hippocampus, lateral ventricle wall, and cerebellum) and in high-grade glioma tissue (the Human Protein Atlas). These images were derived from the Human Protein Atlas. Shown are averages, error bars indicate SD. *p<0.05 student's t test.

