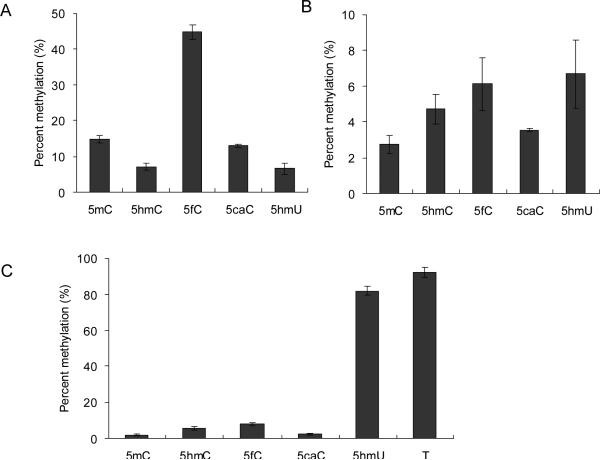
Fig. 4.
Levels of cytosine methylation by DNMT3a at sites 1 (A), 2 (B), and 3 (C) in duplex ODNs after a 6 h reaction (The methylation sites are indicated in Fig. 1A). The data represent the mean and standard deviation of results from three independent methylation reactions.

