
Figure 5.
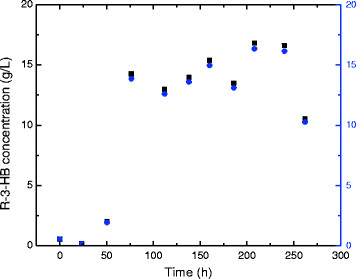
3-HB concentrations in the fermentation broth determined by NMR readings (■) and standard curve (blue circle symbol).
Official websites use .gov
A
.gov website belongs to an official
government organization in the United States.
Secure .gov websites use HTTPS
A lock (
) or https:// means you've safely
connected to the .gov website. Share sensitive
information only on official, secure websites.
3-HB concentrations in the fermentation broth determined by NMR readings (■) and standard curve (blue circle symbol).