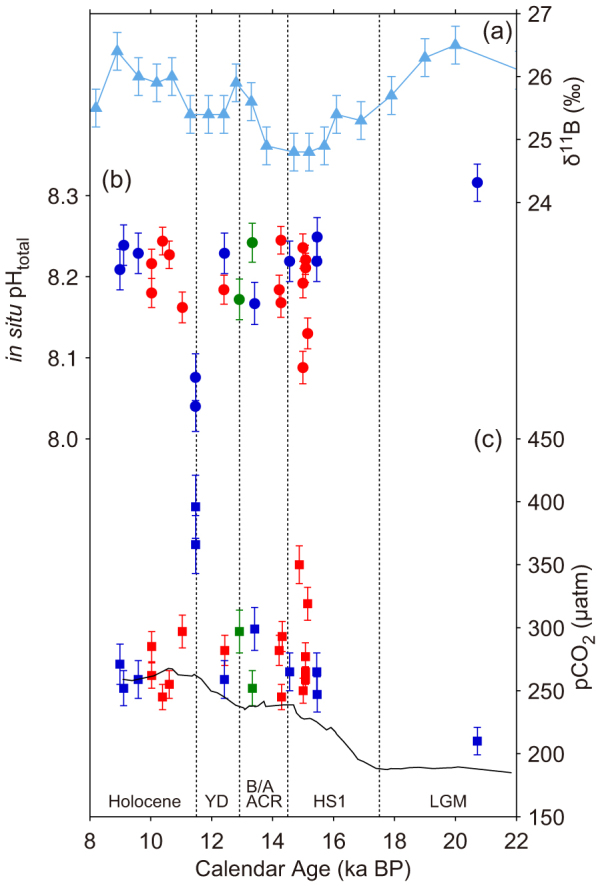
Figure 3. Deglacial δ11B, pH and pCO2 variability in the equatorial Pacific.

(a) Reported δ11B values of planktonic foraminifera with 2σ uncertainty from ERDC-92 (ref. 10). Age model is from the original publication. (b) In situ pH reconstructed from δ11B of fossil Porites spp. using our new calibration. Red and green circles are from Tahiti by this study and Douville et al.11, respectively. Blue circles are from Marquesas by Douville et al.11 after correction by +0.04 pH units. (c) Derived pCO2 of surface water around equatorial South Pacific Ocean (same colors as b) and atmospheric pCO2 on the GICC05 timescale1. All error bars are 2σ. YD, Younger Dryas; B/A, Bølling/Allerød; ACR, Antarctic Cold Reversal; HS1, Heinrich Stadial 1; LGM, Last Glacial Maximum.
