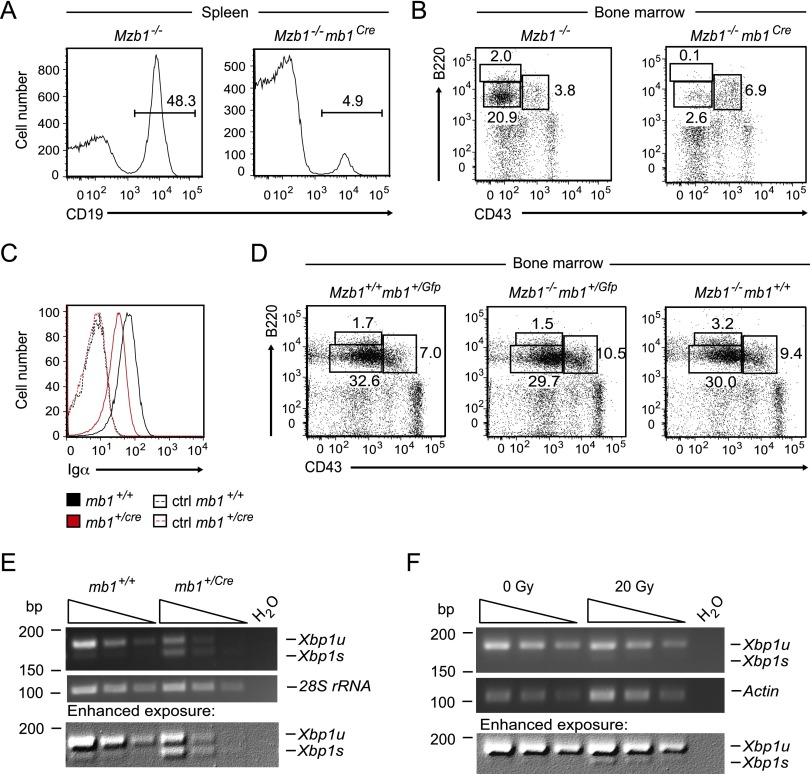
Figure 6.
Mb1Cre-induced genotoxic stress unmasks a role for MZB1 in pro-B cells. (A) Flow cytometric analysis of splenic cell suspensions of Mzb1−/− and Mzb1−/−mb1Cre mice to detect CD19+ B cells within the living lymphocyte gate. (B) FACS profile of Mzb1−/− and Mzb1−/−mb1Cre bone marrow cells to detect B220+CD43+ pro-B and early pre-B cells, B220intCD43− late pre-B and immature B cells, and B220hiCD43− recirculating B cells within the living lymphocyte gate. Data in A and B are representative of four or more experiments. (C) Flow cytometric analysis of mb1+/+ (black line) and mb1+/Cre (red line) B220+CD19+ gated bone marrow cells to detect the intracellular expression level of Igα. Dashed lines represent the respective surface staining with the anti-Igα antibody. Data are representative of six biological replicates each. (D) Flow cytometric analysis of Mzb1+/+mb1+/Gfp, Mzb1−/−mb1+/Gfp, and Mzb1−/−mb1+/+ mice to examine the percentage of B220+CD43+ pro-B and early pre-B cells, B220intCD43− late pre-B and immature B cells, and B220hiCD43− recirculating B cells in the living lymphocyte gate of bone marrow cell suspensions. Data are representative of three or more independent experiments comprising at least two animals per genotype. (E) Semiquantitative RT–PCR to detect transcript levels of Xbp1u and Xbp1s in sorted B220+CD43+ pro-B cells of mb1+/+ and mb1+/Cre mice. The expression level of 28S rRNA served as a loading control. The bottom panel represents an enhanced exposure of the top agarose gel. Triangles indicate 1:3 serial dilutions. Data are representative of three independent experiments. (F) Semiquantitative RT–PCR to detect the expression level of Xbp1u and Xbp1s in IL-7 cultured pro-B cells irradiated with a dose of either 0 Gy as a control or 20 Gy using a γ irradiation source. The transcript level of Actin served as a loading control. The bottom panel represents an enhanced exposure of the top agarose gel. Triangles indicate 1:2 serial dilutions. Data are representative of three experiments.

