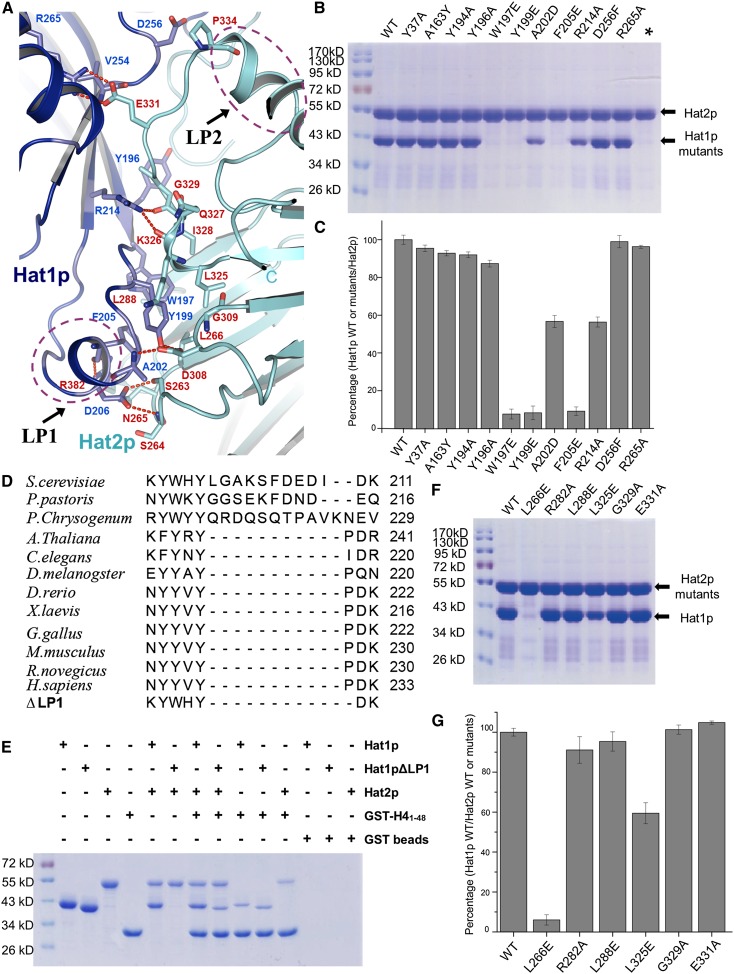
Figure 2.
Binding interface between Hat1p and Hat2p. (A) Close-up view of the interface between Hat1p and Hat2p. The interaction residues of Hat1p and Hat2p are labeled and shown in stick representation and colored in blue and yellow, respectively. The salt bridges are shown as red dashed lines. LP1 of Hat1p and LP2 of Hat2p are circled by purple dashed lines. (B) Pull-down of different Hat1p mutants by wild-type (WT) Hat2p. Each mutation is labeled above the line. (C) The interaction between Hat1p wild type or mutants and Hat2p wild type was evaluated by quantifying the intensity of the bands in SDS-PAGE using the AlphaEaseFC software and normalizing it to the wild type. The presented data are the average of three experiments. The error bars correspond to one standard deviation. The mutants are labeled as in B. (D) The sequence alignment of the LP1 region among species. The deletion of the Hat1p LP1 region is also shown at the bottom. (E) Pull-downs of Hat1p, LP1-deleted Hat1p, Hat2p, and GST-H41–48. (F) Pull-downs of wild-type Hat1p and different Hat2p mutants. Each mutation is labeled above the line. (G) The interaction between Hat2p wild type or mutants and Hat1p wild type was evaluated by quantifying the intensity of the bands in SDS-PAGE using the AlphaEaseFC software and normalizing it to the wild type. The presented data are the average of three experiments. The error bars correspond to one standard deviation. The mutants are labeled as in F.

