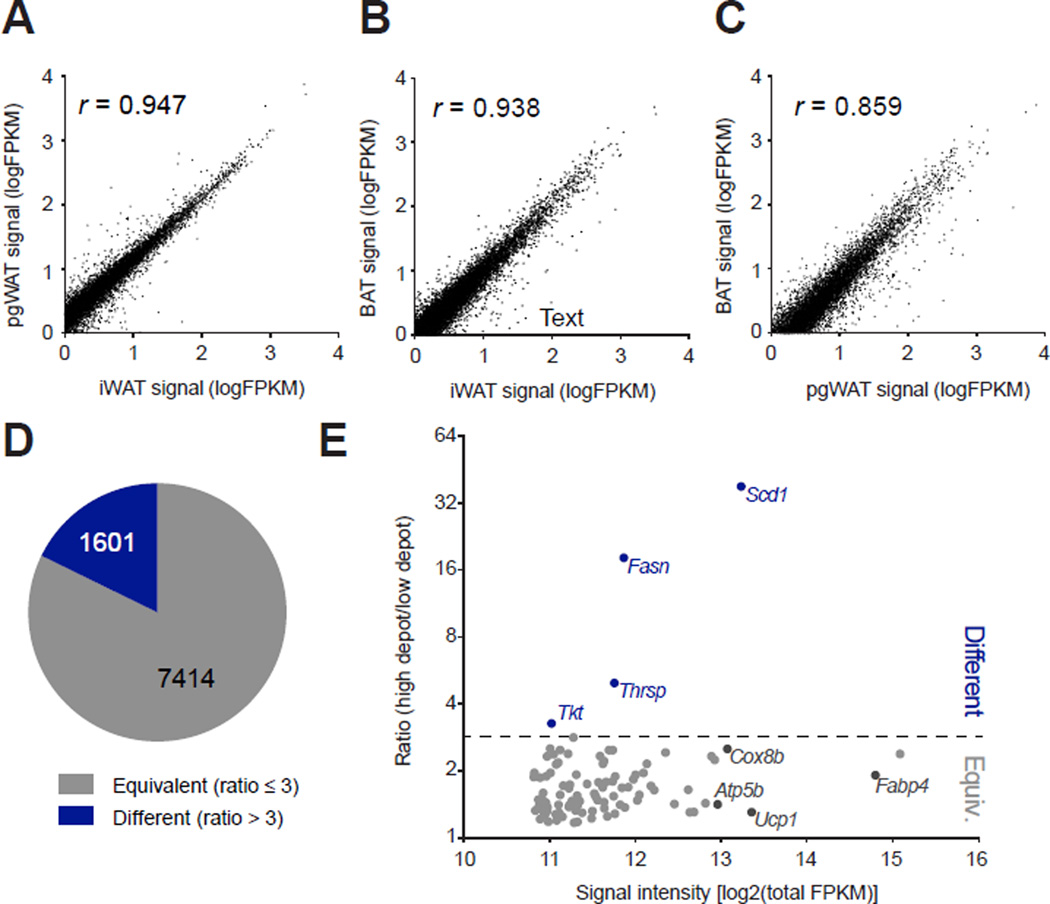
Fig. 2. Identification of the common brown and beige gene expression signature in vivo.
(A–C) The average signal intensities (FPKM) for genes in the UCP1-TRAP-Seq dataset are pair-wise compared between depots. Pearson’s correlation coefficient (r) for each comparison is shown as an insert. n = 2 for pgWAT and n = 3 for iWAT and BAT. UCP1-TRAP-Seq samples were obtained from 6-week old female mice following two weeks cold exposure at 4°C. (D) Pie chart showing the fraction of total detected genes from UCP1-TRAP-Seq classified as either “equivalent” (ratio ≤ 3) or “different” (ratio > 3) (also see Experimental Procedures). (E) Scatter plot showing the ratio metric versus average signal intensity for the top one hundred most abundant UCP1-TRAP-Seq genes. Abundance was determined by total FPKM detected across all UCP1-TRAP-Seq samples.

