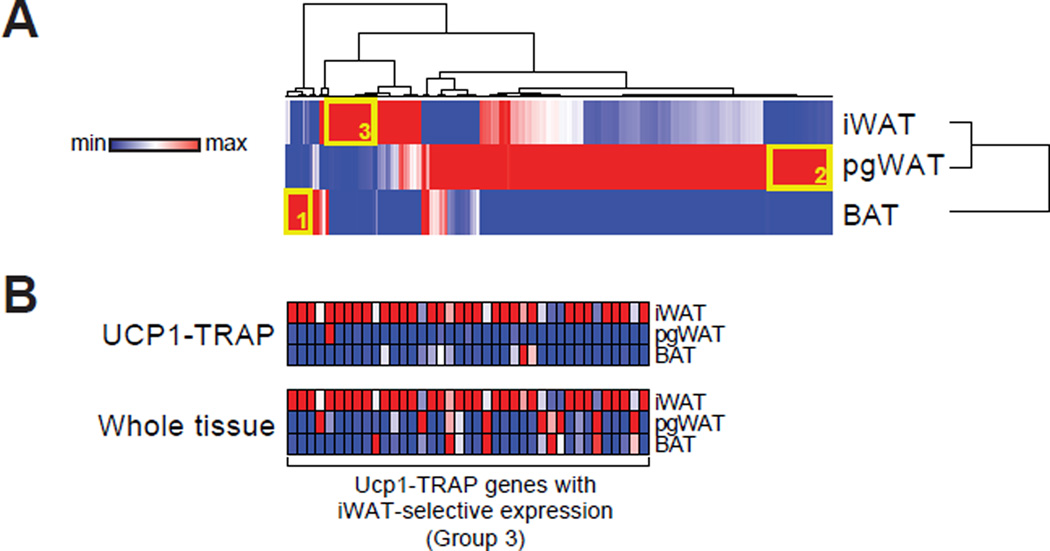
Fig. 3. Analysis of differentially expressed genes.
(A) Hierarchical clustering of the differentially expressed genes (ratio > 3) from the UCP1-TRAP-Seq dataset. Rows and columns were each clustered using the one minus Pearson correlation distance metric. Clustering was performed with the average signal intensity for each depot. n = 2 for pgWAT and n = 3 for iWAT and BAT. (B) Relative expression by qPCR of most abundant iWAT-selective UCP1-TRAP genes (Group 3) from both UCP1-TRAP samples and from whole tissues across depots. n = 3/group; the average signal intensity is shown. For (A) and (B), red and blue indicate relative high and low expression, respectively, for the column.

