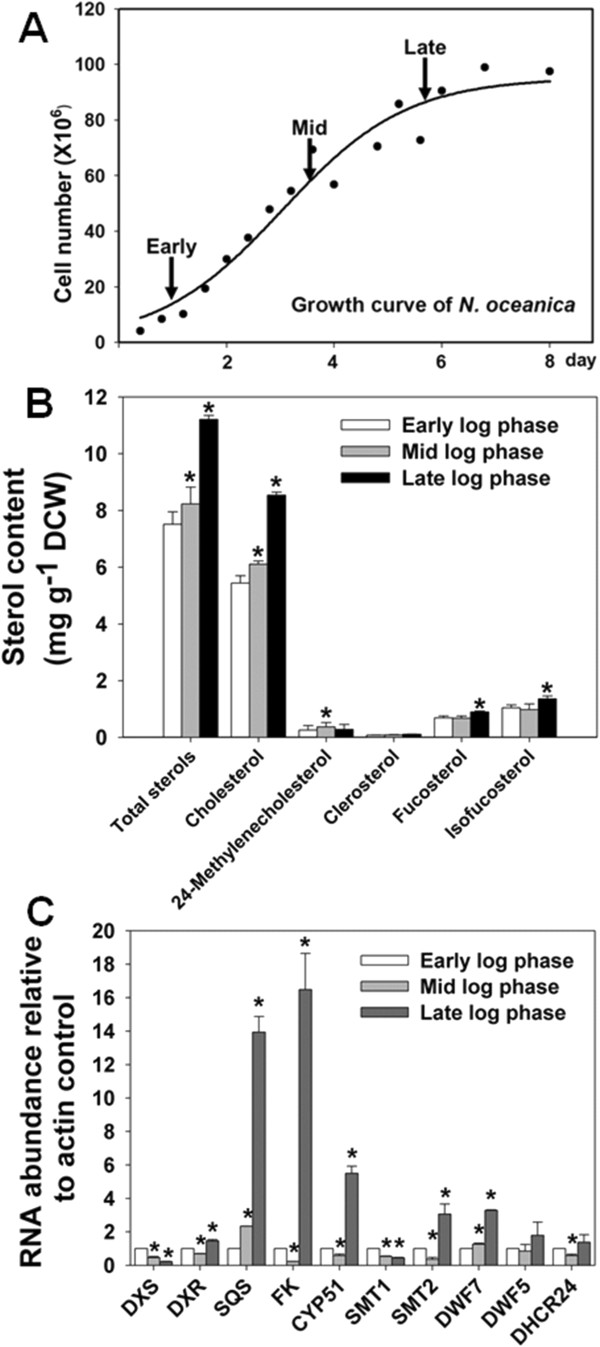
Figure 3.

Chemical analysis and transcripts of sterol biosynthesis during N. oceanica growth. (A) Growth curve of N. oceanica. (B) Changes in total sterol and sterol composition at different growth stages. (C) Transcript levels of sterol biosynthetic genes at different growth stages. The values are the means of three replicates. Asterisks (*) indicate P values < 0.05.
