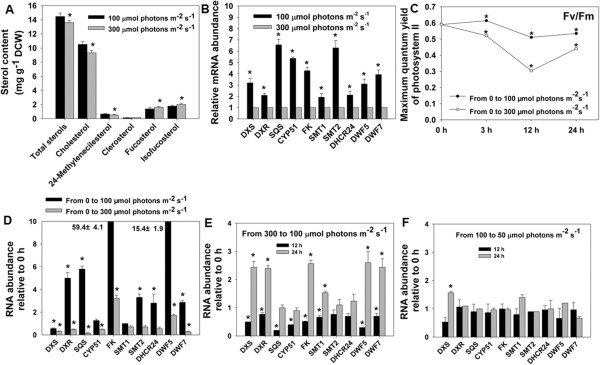
Figure 4.

Transcript levels of sterol metabolic genes of N. oceanica in response to changes in light intensity. (A) Sterol contents under different light intensities. (B) Expression of sterol metabolic genes of N. oceanica under different light intensities. The transcript levels under 300 μmol photons m-2 s-1 are normalized to 1.0. Cells at mid-log phase were transferred to constant light intensities of 100 and 300 μmol photons m-2 s-1. Cells were taken for transcript and sterol analysis after 96 h. (C) Maximum photosynthetic efficiency of photosystem II (PSII) of N. oceanica in response to the transfer from dark to light. Cells at mid-log phase were transferred to dark for 12 h and then transferred to 300 or 100 μmol photons m-2 s-1 light. (D) Relative mRNA abundance of sterol metabolic genes in N. oceanica in response to the transfer from dark to light. (E) Relative mRNA abundance of sterol metabolic genes in N. oceanica in response to a light intensity change from 300 to 100 μmol photons m-2 s-1. Cells at mid-log phase were transferred to 300 μmol photons m-2 s-1 for 12 h, then to 100 μmol photons m-2 s-1. Samples were collected after 12 and 24 h. (F) Relative mRNA abundance of sterol metabolic genes in N. oceanica in response to a light intensity change from 100 to 50 μmol photons m-2 s-1. Cells at mid-log phase were transferred to 100 μmol photons m-2 s-1 for 12 h, then to 50 μmol photons m-2 s-1. Samples were collected after 12 and 24 h. Values are the means of three replicates. Asterisks (*) indicate P values < 0.05.
