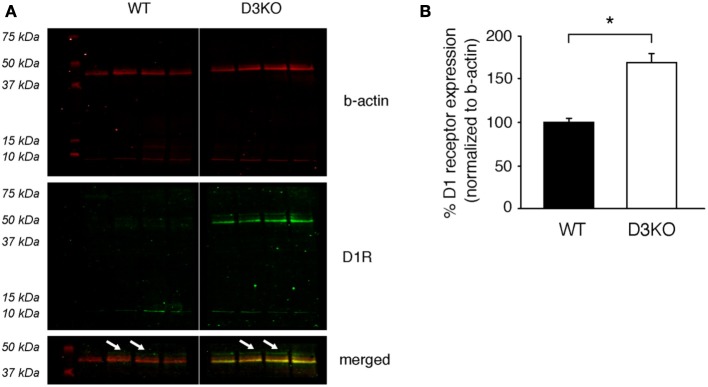
Figure 6.

Protein expression levels of the dopamine D1 receptor in lumbar spinal cord. (A) ß-actin (top panels, red), D1R (middle panels, green), and merged images of the 37–50 kDa band of interest (bottom panels) of the same blot. Note that ß-actin expression is similar in WT and D3KO. In contrast, the D1R antibody recognizes a strong signal at the 42 kDa band that is present only in D3KO, and a weaker signal at the predicted band size of 49 kDa that is differently expressed in WT and D3KO (arrows) and that was used for the subsequent analysis. (B) The quantification of the 49 kDa expression labeling, normalized to ß-actin expression, revealed a significant increase in D1 receptor protein expression levels in D3KO (*p < 0.001).
