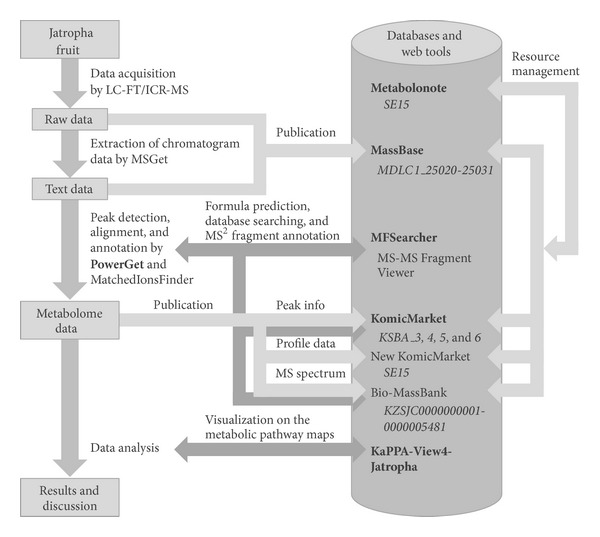
Figure 5.

A schematic representation of the workflow for analysis of metabolomic changes in the developing fruit of Jatropha curcas L. The tools and databases introduced in the main text are shown in bold face. The accession IDs of the data in each database are shown in italics.
