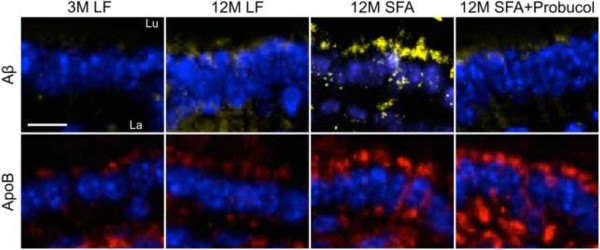
Figure 5.

Immunofluorescent micrographs of small intestinal Amyloid-β and apolipoprotein B. Representative immunofluorescent micrographs of small intestinal amyloid-β (Aβ) and apolipoprotein (apo) B are shown in mice maintained on low-fat (LF) control chow or diets enriched in saturated fats (SFA) with/without probucol for 3 months (3 M) and 12 months (12 M). Aβ and apoB are shown in yellow and red respectively, and the nuclei are shown in blue. “Lu” and “La” indicate intestinal lumen and villi lacteal respectively, and the cell lining between Lu and La are the absorptive enterocytes. The scale bar indicates 10 μm.
