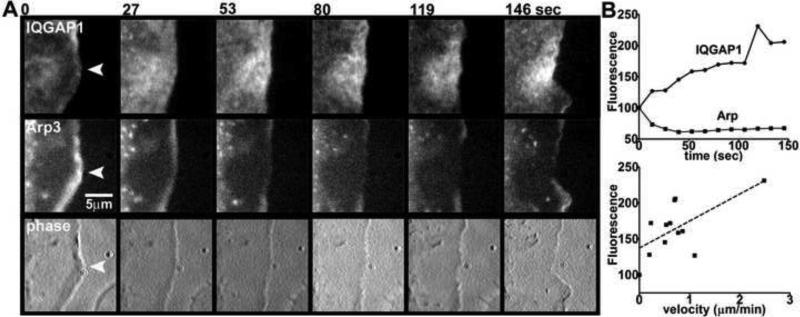
Fig 2.
Correlation of cell edge retraction velocity with IQGAP1. (A) B16F10 cells were cotransfected with GFP-IQGAP1 and mCherry-Arp3, and imaged on laminin for a total time of 146 sec at 13-sec intervals. Select time points show IQGAP1, Arp3 and phase images of an area of cell edge retraction. (B) Frames were analyzed for GFP-IQGAP1 and mCherry-Arp3 intensities, and edge velocity changes in the areas marked by the arrowheads. Top graph is a plot of IQGAP1 or Arp3 fluorescence intensities over time. Bottom graph is correlation of IQGAP1 fluorescence intensity with cell edge retraction velocity (Pearson's r = 0.64, n = 12, p = 0.025).

