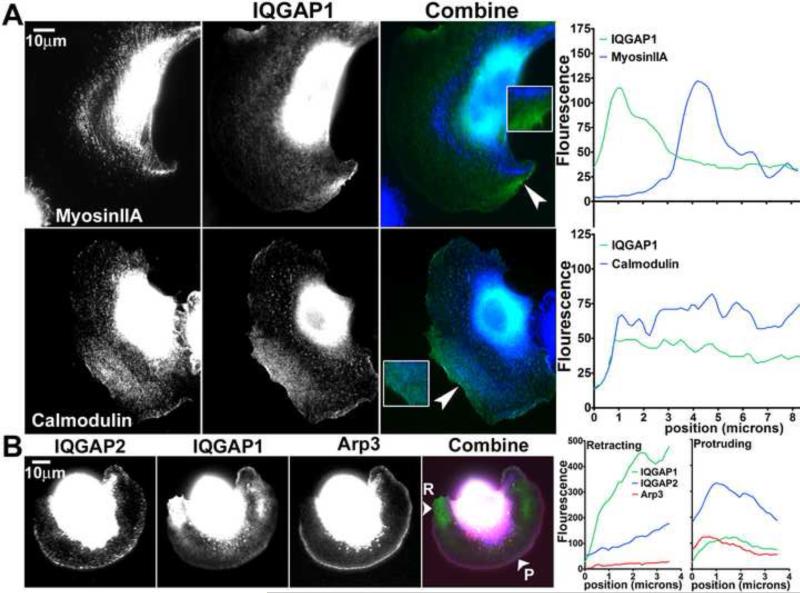
Fig 4.
Subcellular localization of IQGAP1, myosin IIA, calmodulin and IQGAP2 in B16F10 cells. (A) Cells transfected with GFP-IQGAP1 were stained with anti-myosin IIA or anti-calmodulin antibodies. Fluorescence intensity of the IQGAP1 image (green) combined with the myosin IIA or calmodulin image (blue) was quantified using linescan analysis. Arrowheads in the combined images indicate location of linescan that extended 8.5 microns into the cell from the edge. (B) Cells co-transfected with GFP-IQGAP1 and mCherry-Arp3 were stained with anti-IQGAP2 antibodies. The IQGAP2 (blue), IQGAP1 (green) and Arp3 (red) images were combined and fluorescence intensity in retracting (R) and protruding (P) edges was quantified by linescan analysis. Arrowheads in the combined image indicate location of linescan that extended 3.5 microns into the cell from the edge.

