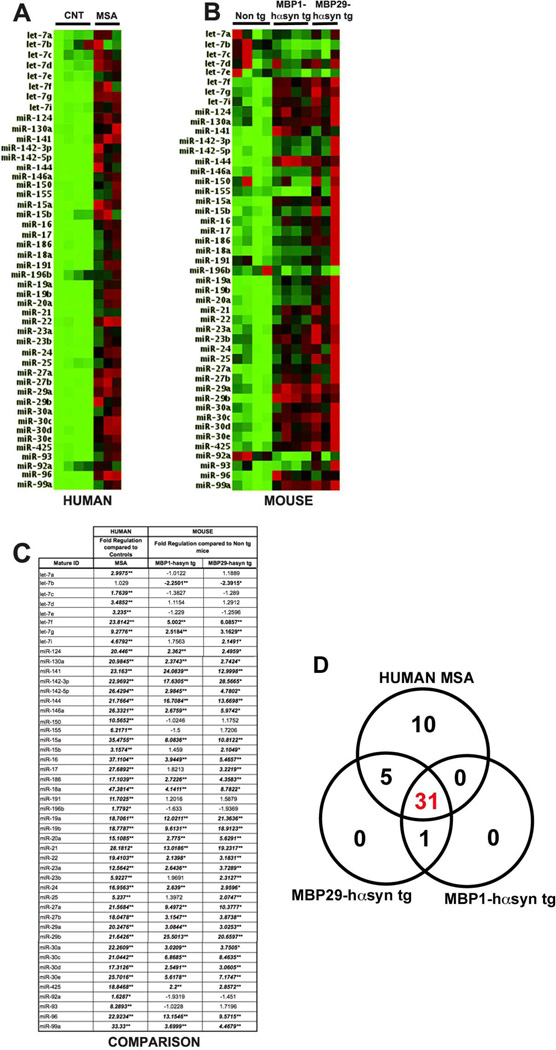
Figure 1. Comparison of miRNA profiles between MSA cases and transgenic models of MSA.
(A) miRNA profiles from control (n=4) and MSA (n=3) cases. (B) miRNA profiles from non tg (n=4), MBP1-hαsyn tg (n=4) and MBP29-hαsyn tg (n=3) mice. All samples were analyzed using the miFinder RT² miRNA PCR Array system (SABiosciences) in order to enable comparison across species. Of the 88 genes present on the human and mouse plates, 47 were identical, these 47 are depicted. The colors indicate the magnitude of fold change over the group average, green indicates down regulation while red indicates up regulation. (C) Comparative fold regulation of the 47 miRNA displayed. Changes that met our selection criteria of ± 2-fold regulation and p<0.05 are in bold and italicized * indicates p<0.05, ** indicates p<0.01 calculated based on a Student’s t-test of the replicate 2^ (- Delta Ct) values for each miRNA. (D) Venn Diagram showing overlapping miRNA dysregulation between the human MSA cases and the two tg mouse models. CNT = Control, MSA = Multiple System Atrophy

