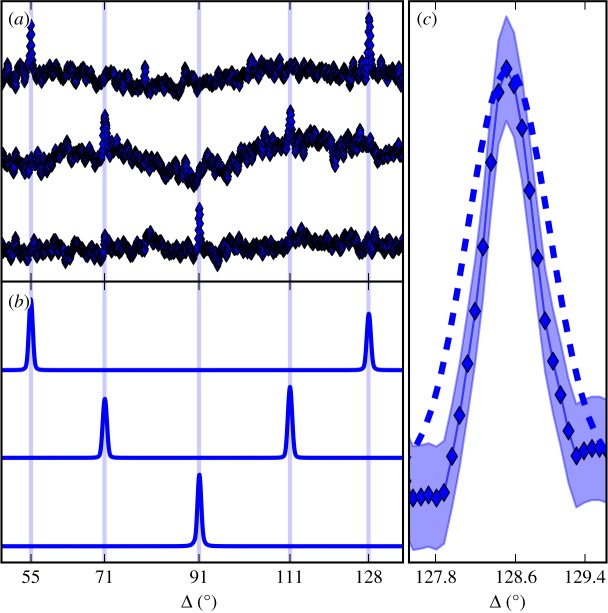
Figure 3.
(a) From top to bottom, measured correlation functions D(q111, q200, Δ), D(q111, q111, Δ) and D(q200, q200, Δ) from 20 nm silver NPs. We truncated the angular range to highlight the correlation peaks. Regions not shown contain artefacts similar to those on the figure, with nothing greater in magnitude than the CXS peaks. (b) Corresponding simulations of the correlations plotted in (a). Vertical lines mark analytical predictions. (c) Simulation (dashed line) and measurement (diamond marker) of a correlation peak width. The simulation was for 20 nm particles. Peak width scales inversely with particle size, hence we expect the measured CXS resulted from particles larger than 20 nm. Shading represents 95% confidence intervals (±1.96 × s.e.) on the measurement. (Online version in colour.)

