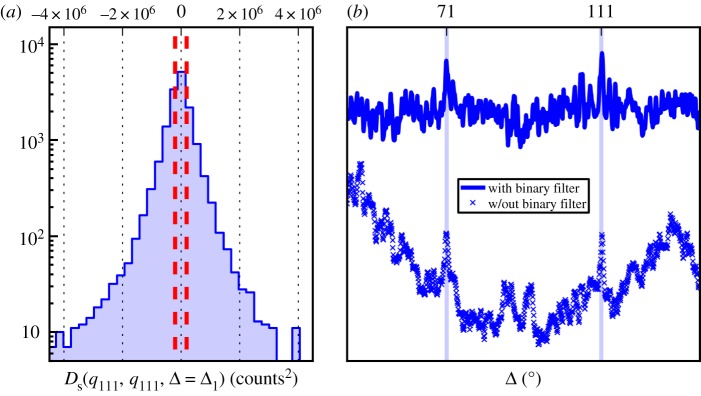
Figure 4.

Shows the shot-to-shot variance in the correlation function (2.5). Large variance is due to the presence of large particles. We illustrate the effectiveness of the binary filter at removing systematic error induced correlations, even when the large particle fluctuations are minimized. (a) Histogram of Ds(q111, q111, Δ = Δ1) over all shots on a log scale (raw data without any filter). Outliers were observed with values up to order 1 × 10⁸ and were removed (not shown). The large tails indicate the presence of large crystals in the data which can contribute to correlations. Red dashed lines mark ±200 k counts2. (b) Plots of D(q111, q111, Δ) for filtered (upper) and unfiltered (lower) data. The average was taken over the 4208 shots where both of the following criterion were met: −200 k counts2 ≤ Ds(q111, q111, Δ = Δ1) ≤ 200 k counts2; −200 k counts2 ≤ Ds(q111, q111, Δ = Δ2) ≤ 200 k counts2. In the unfiltered plot, artificial correlations due to detector and sample anisotropies are similar in magnitude to the true correlation signal. The vertical blue lines mark the analytical prediction of CXS signal (Δ1 and Δ2). (Online version in colour.)
