
Figure 4.
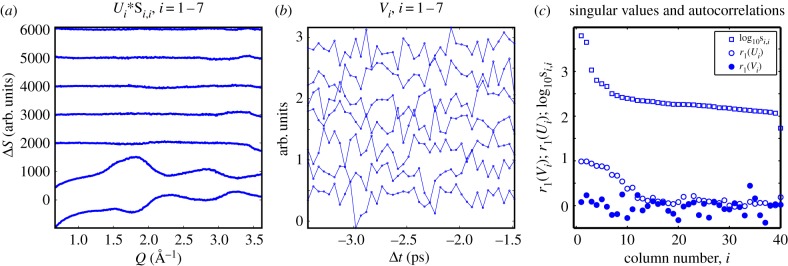
Result of a singular value decomposition of the laser-off data matrix highlighted by the black rectangle in figure 1. Panel (a) shows the seven first left-singular vectors Ui multiplied by their corresponding singular value, Ui,i. Panel (b) shows the seven corresponding right-singular vectors, i.e. the seven first columns of V. Panel (c) shows, from top to bottom, the magnitude of the singular values as a function of column number i as well as the autocorrelation functions of Ui and Vi. The magnitudes of Si,i indicate two dominant contributions to this subset of the data, but no cut-off is evident from R(Ui) or R(Vi). (Online version in colour.)