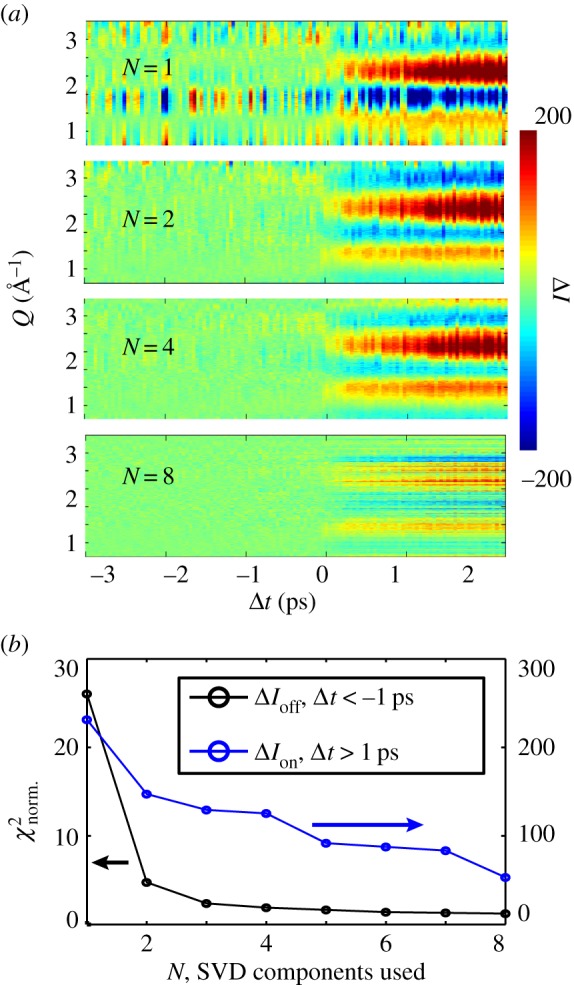
Figure 5.

(a) From top to bottom, the four panels show the data matrix after fitting a linear combination of the first N left-singular vectors to the difference signal and then subtracting the best-fit combination. This is observed to be highly efficient in removing the noise/artefacts. (b) Average χ2 (see main text for details) in the regions preceding and following t0 as a function of number of SVD components included in the background subtraction. Three to four components are observed to efficiently eliminate the noise in the Δt < 0 region, but the background-subtracted signal for Δt > 0 is observed to also decrease as a function of the number of components included in the fit, indicating that fit approach may inadvertently remove real signal. (Online version in colour.)
