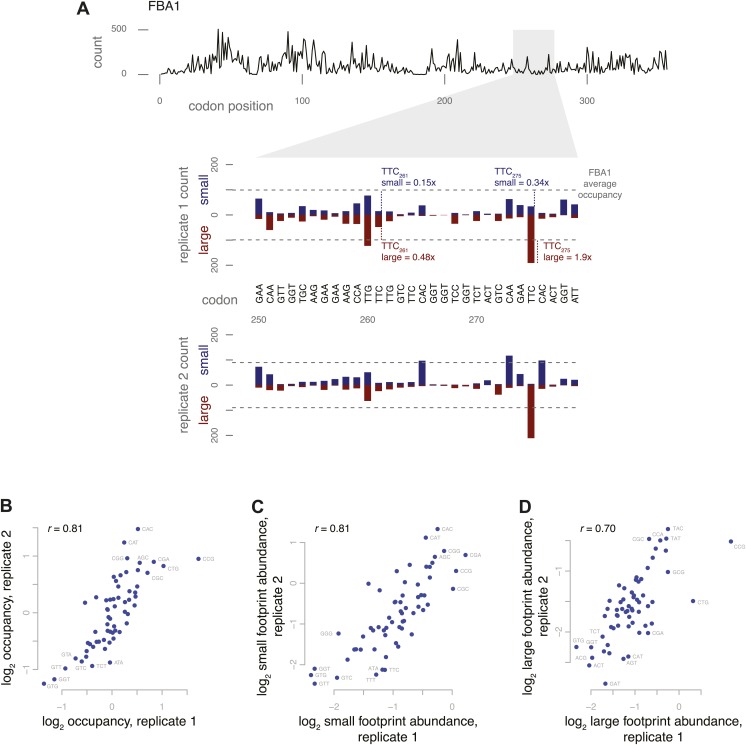
Figure 5. Codon-specific variation in large and small footprint abundance.
(A) Distribution of ribosome footprint counts on the highly expressed gene FBA1, highlighting an arbitrary window, codons 250–279. Ribosome footprint counts per position were consistent between replicates and varied between instances of the same codon in this window. Relative occupancy was estimated based on the codon in the inferred A site. Total (large + small) footprint coverage at each codon of a gene was computed relative to the average coverage for that gene, then averaged by codon across all genes to provide per-codon relative occupancies. Relative abundance of small or large footprints was computed similarly, comparing the count of small or large footprints at each codon of a gene against the average coverage (large + small) for that gene, then averaged by codon across all genes. Examples of small and large footprint abundance values at two specific TTC codons in FBA1 are shown. (B) Relative occupancies of all 61 codons compared between two replicates, with Spearman correlation of 0.81. Stop codons and the first 50 codons of each gene were excluded from analysis. Similarly, small footprint abundance (C) and large footprint abundance (D) compared between replicates.


