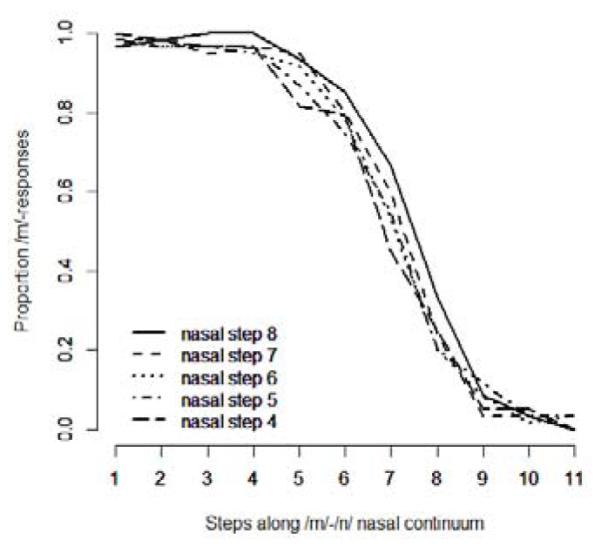
Figure 3.

Results of the pretest for the ama-ana continuum. The y-axis shows proportion /m/ responses. Steps along the /m/-/n/ (labial-alveolar) vowel transition continuum are plotted on the x-axis. The lines represent the middle steps of the original 11 step nasal continuum.
