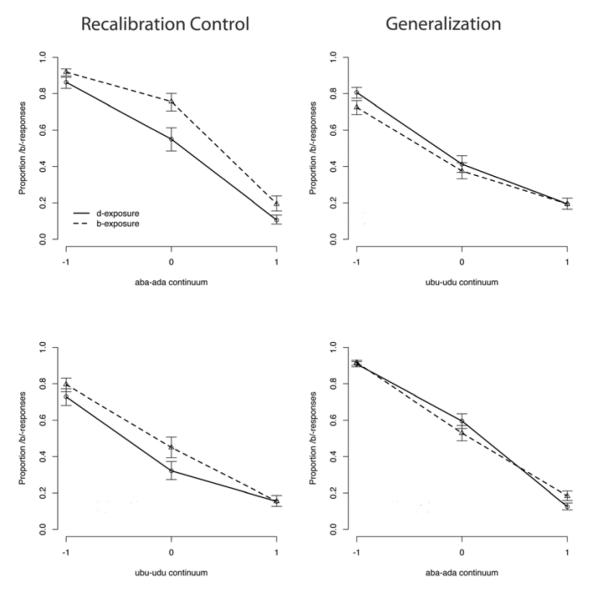
Figure 5.
Results for Experiment 3, the same-phoneme-same-cues-different-context experiment. Proportion labial responses (y-axis) are plotted across the test continua (x-axis). The dashed lines show responses following labial (i.e., /b/) exposure; the solid lines show responses following alveolar (i.e., /d/) exposure. The “error bars“ are based on the Standard Error of the regression weight of Exposure POA in each of the four conditions (see Table 7). The standard error was projected back into the proportion scale, leading to larger intervals around 0.5 and asymmetric intervals at floor and ceiling. The left panels show the recalibration control trials, the right panels show the generalization trials. The upper panels show the condition in which a_a was the exposure context (i.e., formant transitions cues POA of stop consonants), and the lower panels show the condition in which u_u was the exposure context (i.e., formant transitions cue POA of stop consonants but in different vocalic context).

