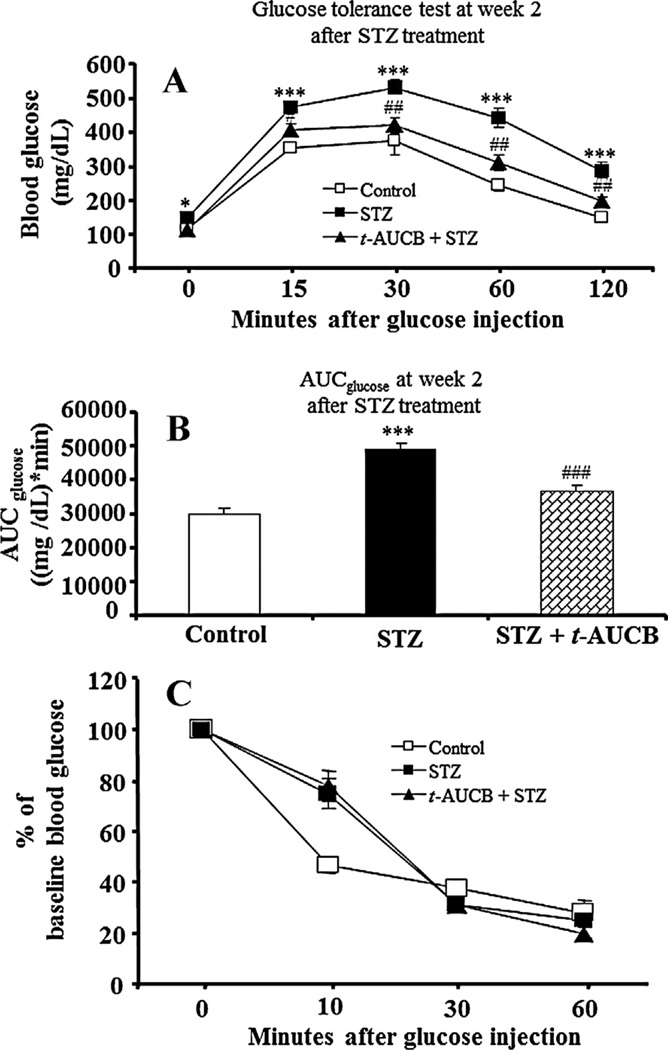
Figure 3.
(A) Intraperitoneal glucose tolerance tests at week 2 after STZ treatment. After a 6-h fast, mice (n = 6) from each group were given an ip injection of 1 g/kg of glucose. Blood glucose was measured before and at varying times after glucose administration. (B) The value of the area under the curve for blood glucose (AUCglucose) for glucose tolerance test in different groups. (C) Intraperitoneal insulin tolerance tests at week 2 after STZ treatment. After a 6-h fast, mice (n = 6) from each group were given an ip injection of 1 U/kg of human insulin. The values of decrease ratios for each group were calculated by dividing the blood glucose level after insulin injection by the initial blood glucose. Results are expressed as the mean ± SE. *P < 0.05, **P < 0.01, ***P < 0.001 versus control; #P < 0.05, ##P < 0.01 versus STZ-treated mice.

