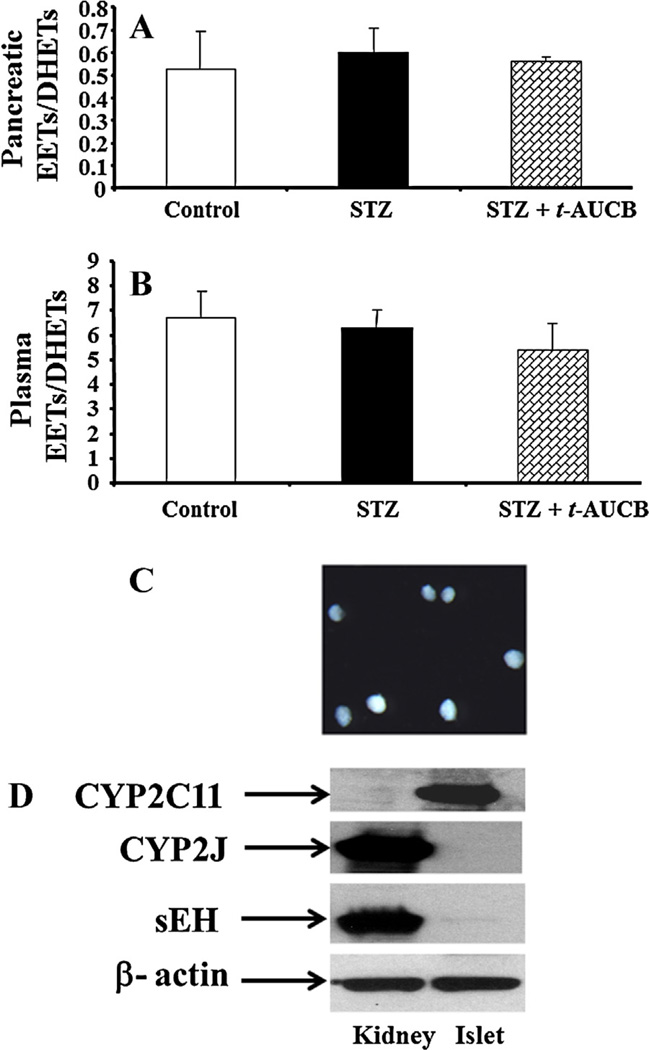
Figure 5.
(A) Pancreatic and (B) plasma ratios of EETs to DHETs ratios in mice given different treatments. After 4 weeks of different treatments, pancreatic samples were collected. LC/MS was used to measure the ratio of pancreatic EETs to DHETs. The levels of EETs and DHETs production in pancreatic samples of the control group were 0.77 ± 0.17 and 1.47 ± 0.27 ng/mg protein/h, respectively. The levels of EETs and DHETs production in plasma samples of the control group were 47 ± 8 and 7 ± 0.9 nM, respectively. (C) The representative image of isolated islets under a dissection microscope. (D) Western blots of CYP2C11, CYP2J, and sEH in mouse kidney (30 µg) and islets (30 µg).

