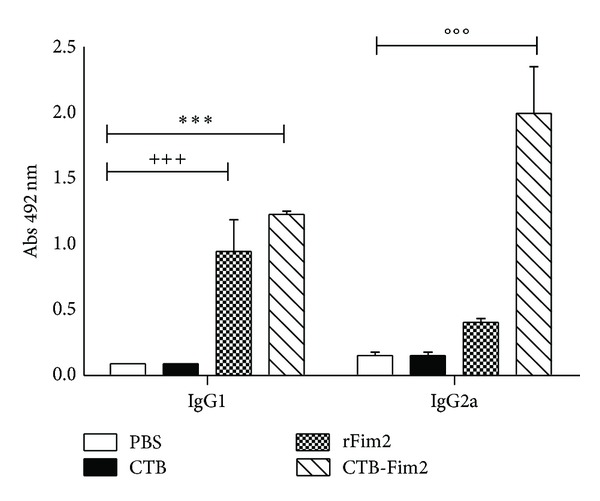
Figure 6.

IgG1 and IgG2a antibody isotype response. Comparison of the serum anti-Fim2 IgG1 and IgG2a levels induced by PBS, CTB, rFim2, or CTB-Fim2 via the intranasal (IN) route. Sera were collected from mice on day 36. The anti-Fim2 IgG1 and IgG2a titers were determined using ELISA. Data are expressed as the mean (±standard error) absorbance at 492 nm for each group. Statistical differences were observed in different comparisons (IgG1 CTB-Fim2 versus all other categories except rFim2 ***P < 0.0001, rFim2 versus all other categories except CTB-Fim2 +++ P < 0.0001, and IgG2a CTB-Fim2 versus all other categories °°°P < 0.0001).
