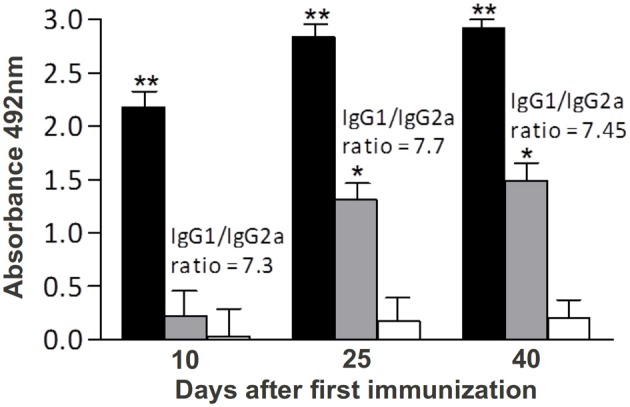
Figure 3.

Kinetics of specific anti-rSMYB1 IgG, IgG1, and IgG2a antibodies in sera from mice vaccinated with rSMYB1. Sera were collected from 10 immunized mice per group prior to the first immunization and at days 10, 25, and 40 after the first immunization and assayed by ELISA. The results are presented as the mean absorbance at 492 nm for each isotype on each day of sera collection. Asterisks indicate statistically significant differences between the vaccinated and preimmune groups: *p < 0.05; **p < 0.01. Black bars: IgG antibody. Gray bars: IgG1 antibody. White bars: IgG2a antibody. The results are representative of two independent biological replicates.
