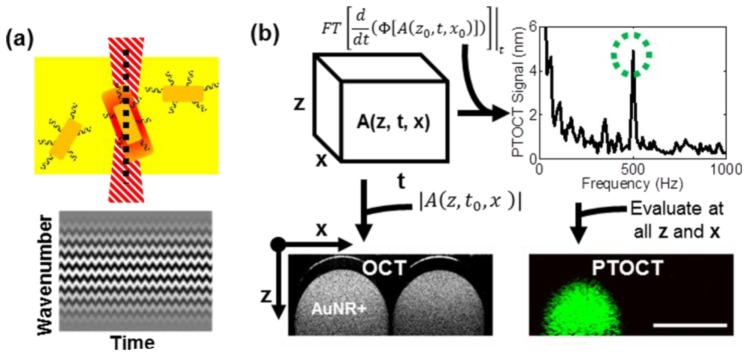
Fig. 2.

PTOCT signal analysis. (a) AuNRs (dark yellow, top) in optically scattering tissue (bright yellow, top) are identified by the OCT imaging beam (black dashed line, top) by their photothermal heat release signature after absorption of an amplitude-modulated heating beam (red dashed structure, top). Oscillations in heat release from AuNRs cause oscillations in optical path length and thus the phase of the OCT interference pattern over time (bottom). (b) For each PTOCT B-scan, a complex-valued 3D data set is constructed as a function of depth (z), space (x), and time (t) (top left). The temporal derivative of the phase (Φ) of this 3D data set is taken, followed by a temporal Fourier transform (top left). A peak in this Fourier-transformed data at 500 Hz (the amplitude-modulation frequency of the photothermal beam, green-dashed circle) reveals the presence of AuNRs (top right). This analysis is repeated at all spatial positions to reconstruct the 2D cross-sectional PTOCT image, which localizes AuNRs (green pixels, bottom right). The magnitude of the depth-resolved data set provides the traditional OCT structural image (bottom left). Bottom panels show representative OCT and PTOCT images of a solid agarose phantom with AuNRs spatially confined to the left capillary tube (scale bar = 1 mm).
