Fig. 6.
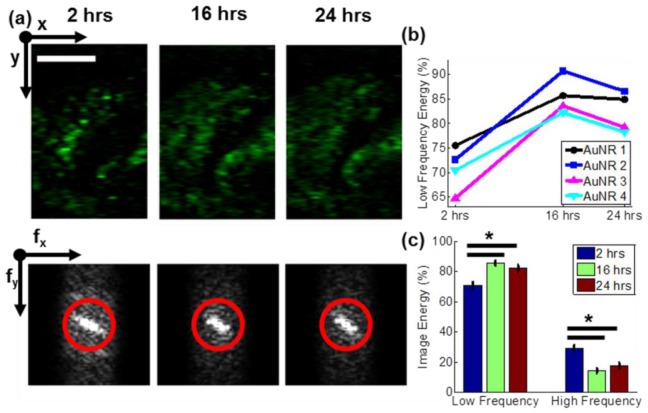
Spatial frequency content analysis of in vivo PTOCT images reveals an increase in low spatial frequencies over time. (a) PTOCT en face images (top) and accompanying 2D spatial Fourier transforms (bottom) from a representative mouse tumor 2 hours, 16 hours, and 24 hours after injection of AuNRs (scale bar = 1 mm). The red circle highlights the cutoff between high (outside the ring) and low (inside the ring) spatial frequencies. (b) Percent of image energy due to low spatial frequencies over time for four mice injected with AuNRs. (c) Mean ± standard error of the image energy due to low and high spatial frequencies for mice injected with AuNRs (n = 4) over time. *p < 0.05.

