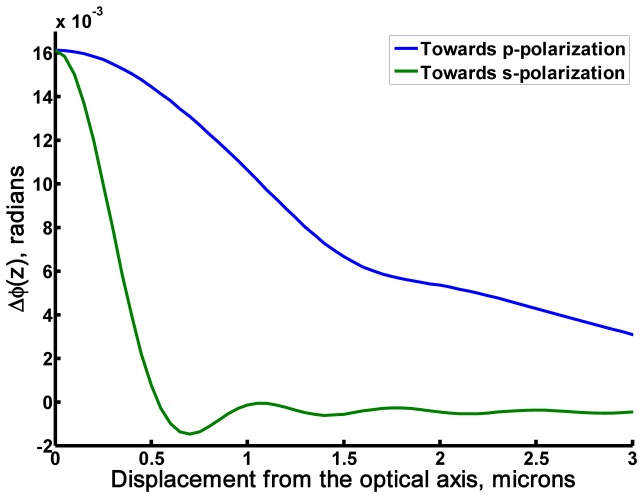
Fig. 7.
Shows the phase shift as a function of displacement of the beam from the optical axis at z = −2.5 μm defocus of analyte with radius of 400 nm and thickness of 1 nm (n = 1.5 in water ambient); the blue line represents the displacement of the analyte along p-polarisation and the green line represents the displacement of the analyte along s-polarisation direction.

