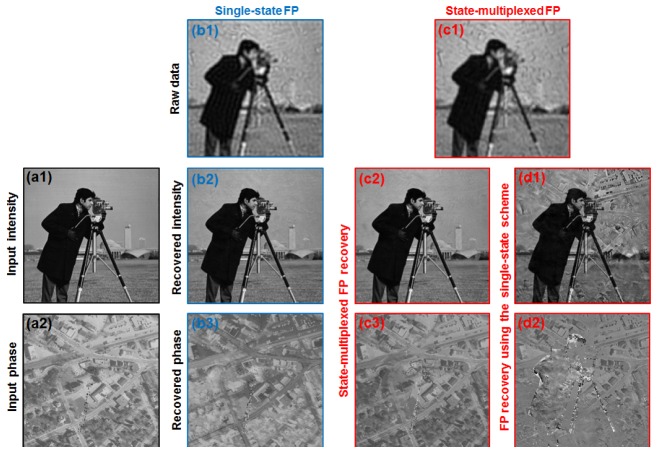
Fig. 2.
Simulations of the single-state and state-multiplexed FP schemes. (a1) and (a2) The input intensity and phase images of the simulated object. (b1) Raw data of the single-state FP scheme. Each low-resolution image (0.1 NA) corresponds to one LED element in the array. (b2) and (b3) The recovered sample intensity and phase images using the single-state FP scheme. (c1) Raw data of the state-multiplexed FP scheme. Two adjacent LED elements are lit up simultaneously for sample illumination, and each low-resolution intensity image (0.1 NA) represents an incoherent summation of two coherent states. (c2) and (c3) The recovered sample intensity and phase images (0.5 NA) using the state-multiplexed FP scheme. (d1) and (d2) The reconstructions of state-mixed raw data using the single-state FP scheme (for comparison).

