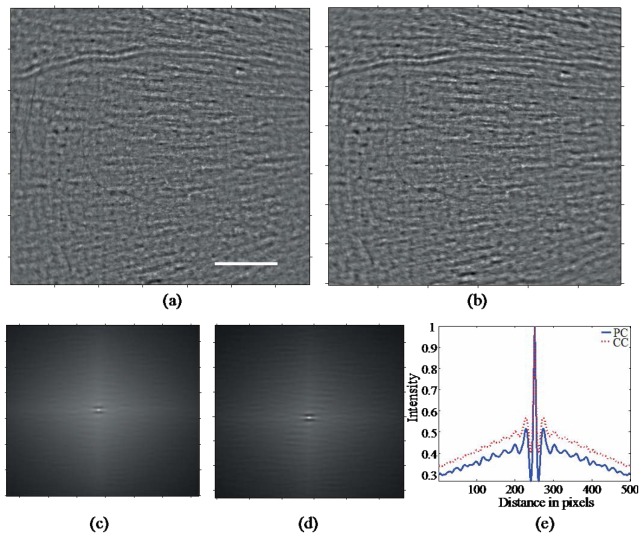
Fig. 3.
Image sequence corrected for translation using (a) cross-correlation and (b) phase correlation, (c-d) autocorrelation function (ACF) of the images shown in Fig. 3(a)-3(b) respectively and (e) intensity line profiles taken from ACF shown in Fig. 3(c)-3(d) respectively. The scale bar is 100µm.

