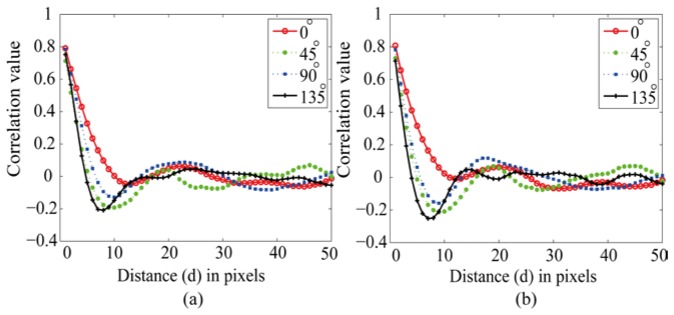
Fig. 7.

Correlation of the GLCM of sampling areas shown in Fig. 6: (a) translation corrected and (b) translation and rotation corrected. The ripples represent the presence of a repeating pattern in the image, corresponding to the nerve fiber striae. The curve corresponding to 135° indicates that the nerve fiber structure is clearer in the de-rotated data.
