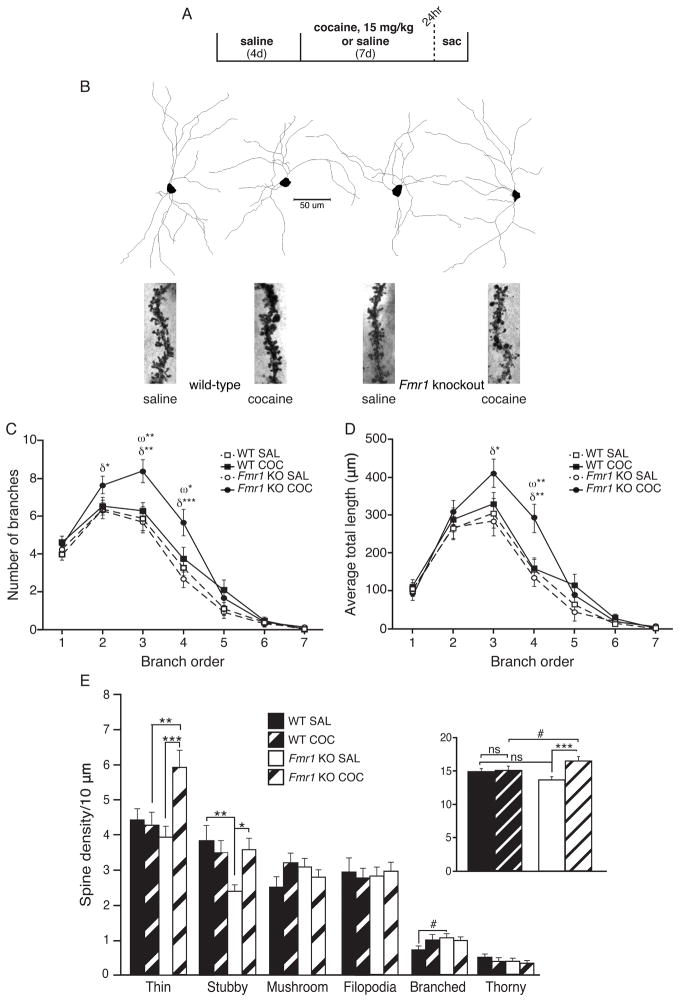
Fig. 4. FMRP opposes cocaine-induced changes in dendritic branch morphology and structural synapse number.
(A) Timeline for NAc shell and core MSN dendritic analyses. (B) Example MSN tracings and focused image stacks of spines from each group. (C) COC treatment significantly increased core MSN 2nd, 3rd and 4th order branches inFmr1 KO mice, but not WT littermates. Also, KO MSNs had significantly more 3rd and 4th order branches than WT MSNs after COC, but not SAL (n, cells=22 WT SAL; 23 WT COC; 22 KO SAL; 22 KO COC). (D) In keeping, the total length of 3rd and 4th order core MSN branches was increased by COC in Fmr1 KO, but not WT mice, and 4th order branch length was increased in KO compared to WT MSNs following COC, but not SAL. (E)An increase in overall spine density of NAc shell MSNs was seen in Fmr1KO, but not WT mice, following COC (inset). Analysis by spine type revealed a basal decrease in KO SAL stubby spine density compared to WT SAL, accompanied by a strong trend towards a significant increase in branched spines in KO compared to WT SAL-treated mice. COC treatment increased both stubby and thin spine densities in KO mice compared to SAL treatment. While COC treatment “rescued” a low basal density of stubby spines in Fmr1 KO mice to no different than either WT group, thin spine density was significantly elevated above that of WT COC. Symbols indicate significant simple main effects of genotype (ω) and treatment (δ). In E, asterisks refer to significant follow-up Univ ANOVAs. Focused images were created using an ImageJ Extended Depth of Field plug-in (Aguet et al., 2008) (http://imagej.nih.gov/ij/). (Scale bar=50 um; # p<0.10, * p<0.05, ** p<0.01, *** p<0.001, ns=not significant; data shown are mean±S.E.M.; see also Table S1 & Fig. S4.)

