
Figure 6.
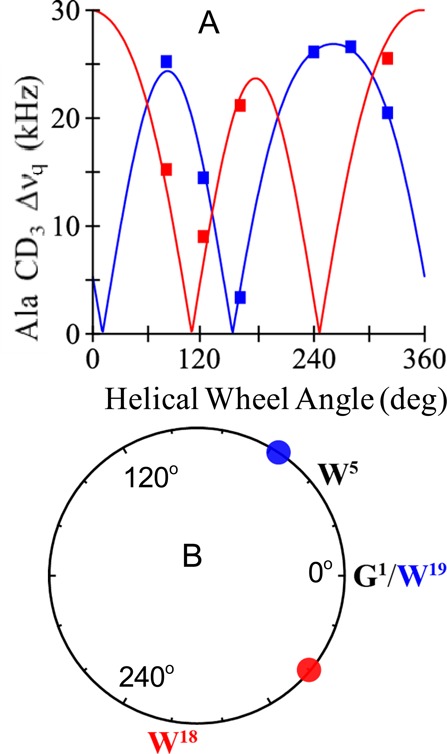
(A) Quadrupolar wave plots for W18GWALP23 (red) and GWALP23 itself (blue) in DLPC. (B) Helical wheel diagram to illustrate the relative azimuthal rotation ρ for W18GWALP23 (red circle) in relation to (W19)GWALP23 (blue circle) in DLPC, offset by ∼100°. The labels W18 and W19 represent the respective radial locations of the tryptophans, which differ by 100° on the helical wheel.