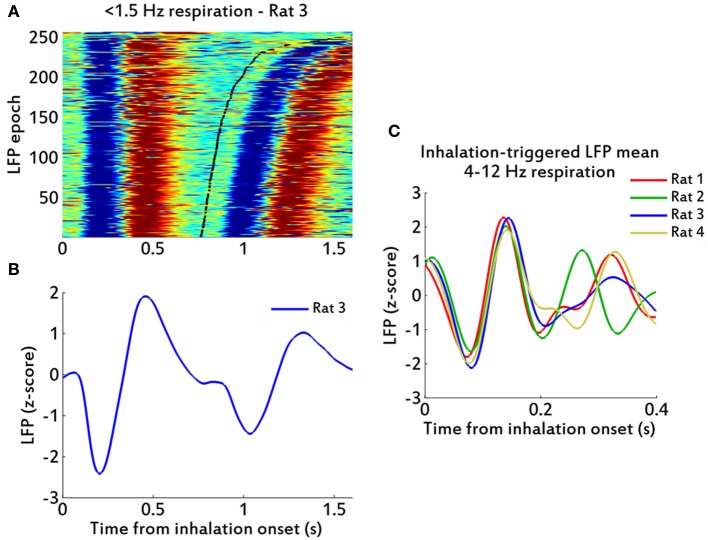
Figure 5.
LFP oscillations in low and high frequency respirations. (A) Raster plot of peri-inhalation LFP epochs for rat 3, for slow (<1.5 Hz) cycles, sorted by respiration cycle duration (shortest at bottom; bottom axis in seconds). Black line marks the ends of the respiratory cycles. Red color indicates values greater than zero. (B) Inhalation-triggered LFP mean for data in (A). (C) Inhalation-triggered LFP means for data of respiratory frequencies between (4–12 Hz), showing one trace per rat.

