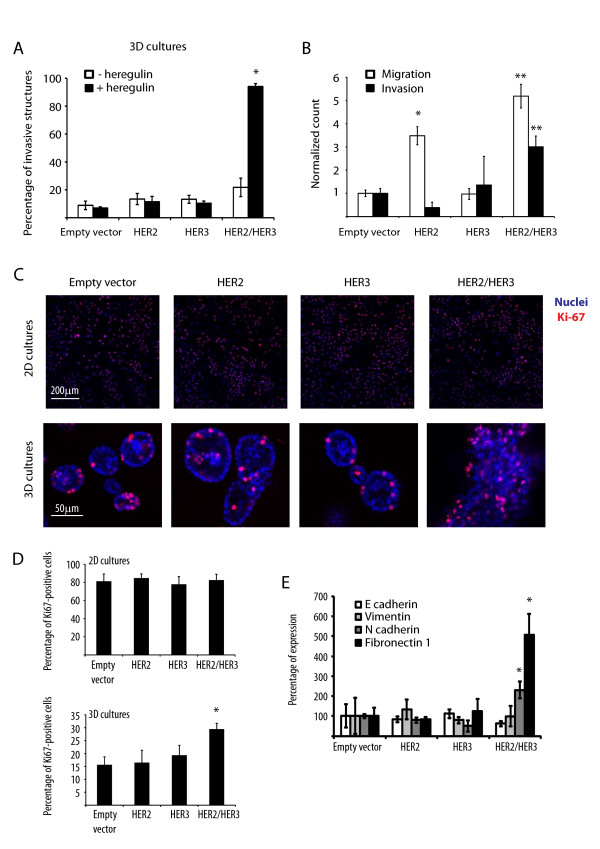
Figure 1.

HER2 and HER3 co-expression induces mammary cell invasion, migration and proliferation. (A) Percentages of invasive structures in the presence or absence of heregulin 10 ng/ml. Results represent means ± standard error of the mean (SEM) (n = 3, *P < 0.05). (B) Normalized cell count for the migration and invasion assays. Results represent means ± SEM (n = 3, *P < 0.003, **P < 0.002). (C) Representative confocal images of equatorial cross-sections of MCF10A cells expressing empty vector, HER2, HER3 or HER2/HER3 grown in two- or three-dimensional cultures for 15 days in the presence of 10 ng/ml heregulin and stained with TO-PRO (blue) and anti-Ki67 antibodies (red). (D) Percentage of Ki67-positive cells when grown in two- or three-dimensional cultures. Results represent means ± SEM (n = 3, *P < 0.03). (E) Quantitative real-time PCR on RNA extracts of MCF10A cells expressing empty vector, HER2, HER3 or HER2/HER3 grown in two- or three-dimensional cultures for 15 days in the presence of 10 ng/ml heregulin. Quantitative real-time PCR was performed using primers against the epithelial-to-mesenchymal transition (EMT) markers E-cadherin, N-cadherin, vimentin and fibronectin1. Results represent means ± SEM (n = 3, *P < 0.05).
