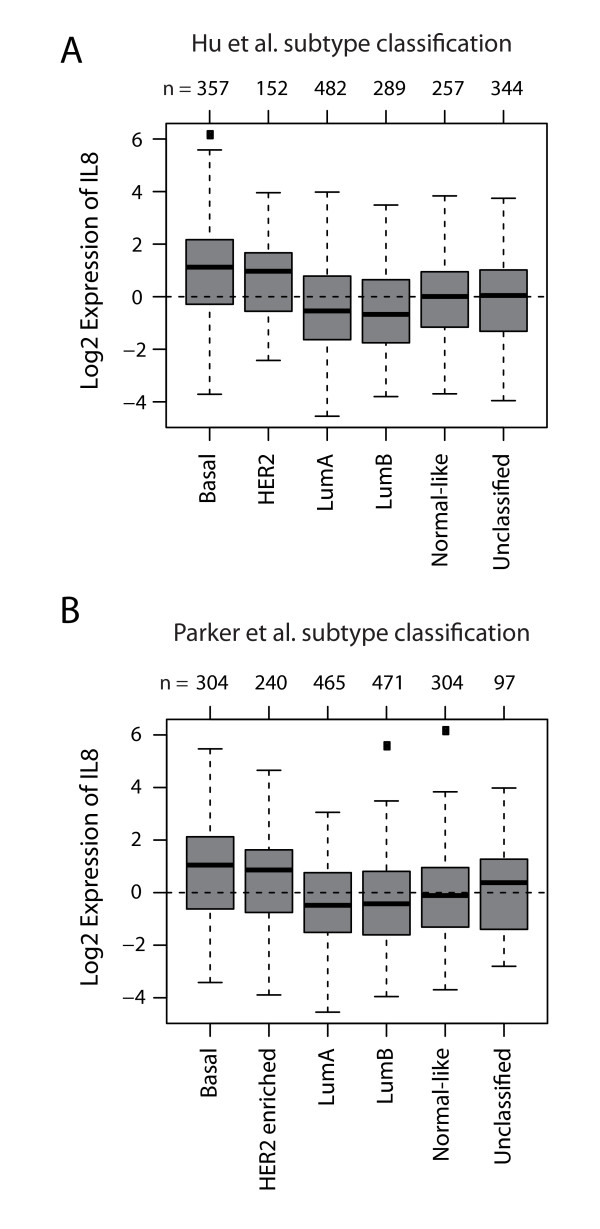
Figure 3.

IL8 expression correlates with HER2-enriched and basal breast cancers. Gene set analysis (GSA) of IL8 expression in a dataset comprising 1,881 primary breast tumors http://co.bmc.lu.se/gobo. (A) Box plot of IL8 expression in breast tumor samples classified into six molecular subtypes according to the classifiers of Hu et al. [16]; P < 0.0001 by analysis of variance (ANOVA). (B) Box plot of IL8 expression in breast tumor samples classified into six molecular subtypes according to the classifiers of Parker et al. [17]; P < 0.0001 by ANOVA. Numbers above the charts report the number of patients in each subtype group.
