
Figure 2.
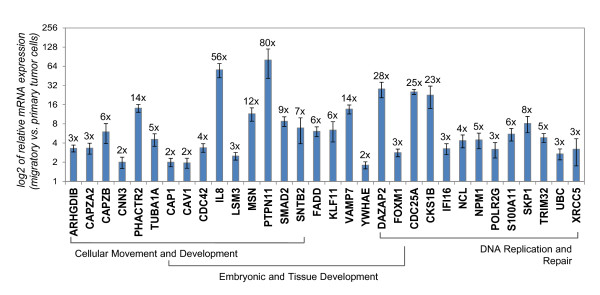
Validation of specific genes upregulated in the migratory breast tumor cells. mRNA expression of genes from the top three significant upregulated function networks in Table 1 was assessed with real-time polymerase chain reaction (PCR) in independent biological repeats of migratory tumor cells versus average primary tumor cells from MDA-MB-231 breast tumors. Genes are grouped by function, as determined by Ingenuity Pathways Knowledge Base (IPA) and Gene Ontology annotations. Bars, relative average mRNA expression of migratory tumor cells compared with average primary tumor, log2-transformed scale for ease of display. The linear fold-upregulation for every gene is shown at the end of every bar. Error bars: SEM, n = 6, P < 0.05 for all data shown in this graph (Student t test).